It took a while to decide the title of this post but I am still unsure whether it conveys the purpose of the post. The point is that we all start our Grafana journey by creating some cool graphs in a dashboard, but after a while we typically end up with many many dashboards … so eventually we start looking for an at-a-glance view that summarizes all our dashboards. Think of one of those dashboards that use at the operations centers
We are going to explore some techniques that enable you to build such a hierarchy in Grafana:
- Links in Grafana
- Create an overall health score metric. In order to keep this article of reasonable length I have covered this in another article
Creating Links
The objective is to have a top level dashboard that summarizes all the others. We also need a way of bringing up those other second level dashboards if we want more detail about a specific system. In this section we will see how to create links in Grafana.
In my environment I have 2 dashboards:
- Top. This is my pretend top level dashboard that will contain the at-a-glance view of all my monitored systems. This dashboard is likely to contain “Stat” panels (and maybe gauges) showing the overall status of multiple systems
- Second. This is a dashboard that contains details about a specific system and as such is likely to contain time series, chart panels and other sophisticated visualizations
In Grafana you can create links at the panel level and the dashboard level
Panel Links
The main idea here is that if I click on one of the stat panels it will take me to the second level dashboard where I can see all the details. Maybe the stat panel is showing a red colored “CRITICAL” message and by clicking on it I can go to the second level and see what subsystem is causing the issue.
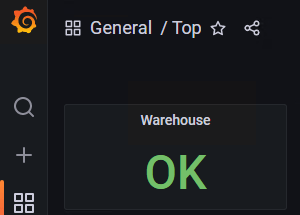
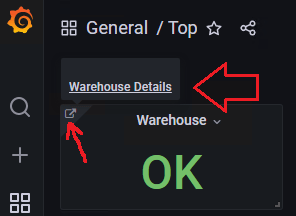
In my “Top” level dashboard I have currently a single Stat panel that shows us the health of a certain location, a “warehouse” in this case. There will be some metrics that we aggregate to produce this “health”. In the next article we will explore how to do that. For now this is how it looks:
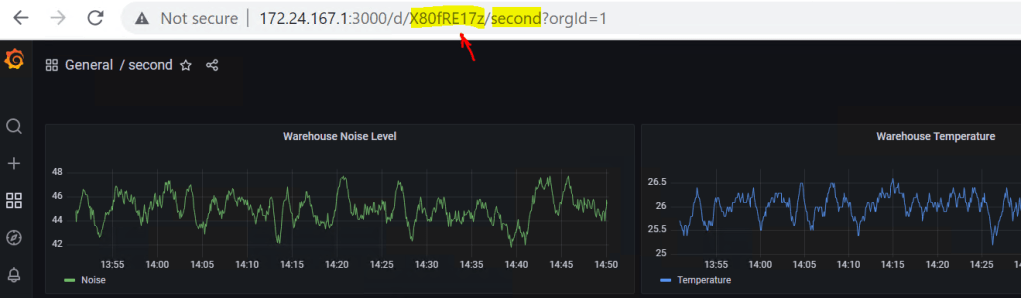
Dashboards in Grafana are displayed in a browser by using their URL. This includes a unique ID as well as the actual name as you can see in the following screenshot. You will need to record the URL of the “second” level dashboard so go ahead, open the “second” level dashboard and record its URL.
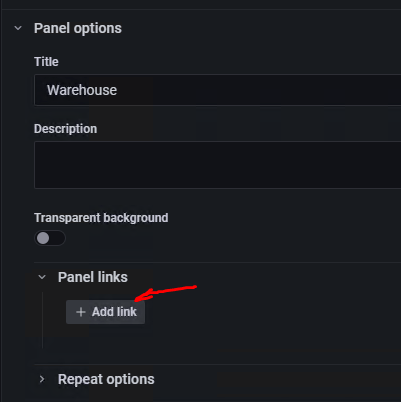
Once you have the URL you can go to the Top level dashboard and define a link on the “Warehouse” health stat panel. Then go to the Options section in the right pane and select “Panel links” and then “Add link”
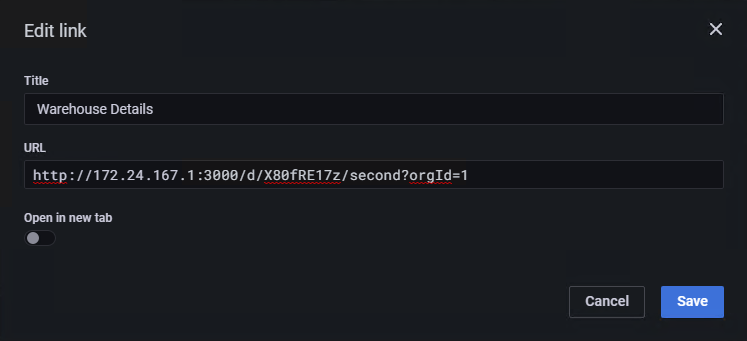
Here you can add a title for your link and the URL of the second level dashboard we save in the previous step. Optionally you can choose to open the second dashboard in a new tab. Click “Save” and get out of Edit mode
Now, in the “Top” level dashboard you can see a little arrow icon on the top-left corner of the Stat panel. If you hover your mouse over it you will see the title of the link you provided. And when you click on it it will open the second level dashboard
Dashboard Links
The other alternative is to create dashboard links. These will permanently display at the top-right corner of your dashboard.
Let’s go ahead and create 2 dashboard links:
- Link to other dashboards
- Link to an external site
Start by opening the dashboard settings. You will find the icon at the top-right corner of the dashboard

Then click on “Links” on the left and then “New Link”. Let’s create a link called “Dashboards”. The “Title” is the string that will be clickable. For “Type” we select “Dashboards”. If you only have a handful of dashboards they will all display in the same line. However if you are planning to have many, it’s better to tick the “Show as dropdown” checkbox to things neater.

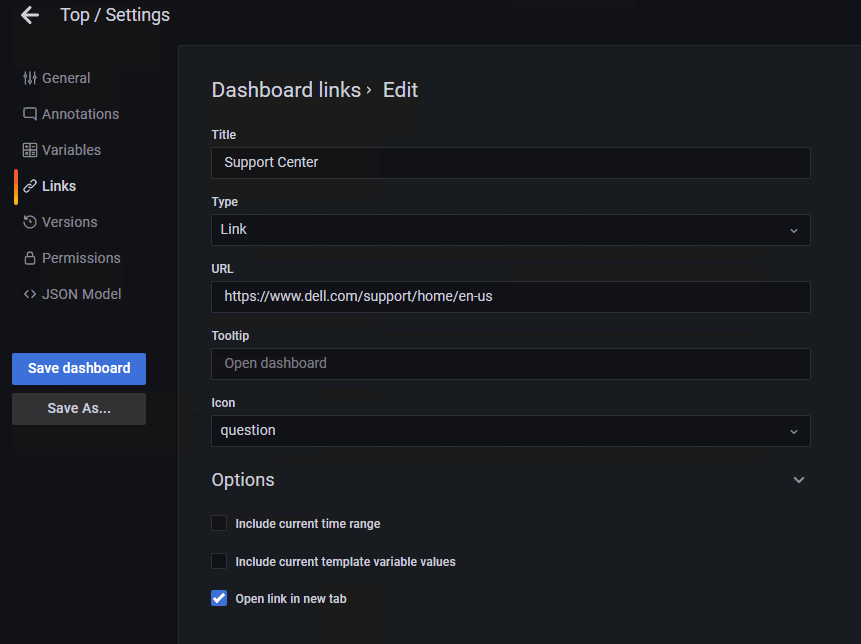
Considering this “Top” level dashboard is likely to show in an operations center, another use case would be to have handy some links related to support, such as an internal ticketing system, a vendor support site or a list of emergency contacts. Now let’s go ahead and create another link that links to the support page of a vendor so that we can open a service request. This time we will select the “Link” type and provide the URL to open when clicked. You can customize the link by selecting an “icon” that is meaningful for your use case. Notice how I have also force it to open the linked page in a “new tab” as we want our dashboard to remain open after we are done with the service request
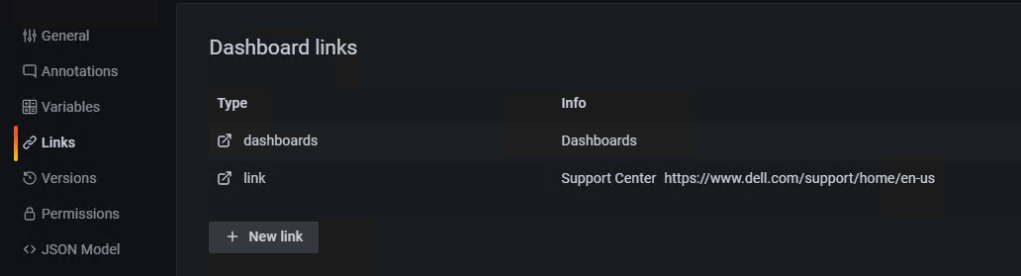
This is what the “Links” menu in dashboard “Settings” looks like with both links configured
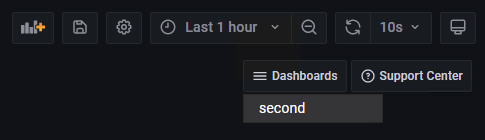
Finally “Save Dashboard” and once in the dashboard you should see something like this. Notice how I have clicked in the “Dashboards” button and the existing dashboards (which is only “second” in this case) are shown
In the next article we will focus on how to create aggregate multiple metrics into a overall health number.
Categories: DellEMC


3 replies »