Tag: DevOps

  • Integrating Generative AI in ITSM Workflows

    Integrating Generative AI in ITSM Workflows

    IT Service Management (ITSM) teams are increasingly turning to generative AI (GenAI) to streamline workflows, reduce resolution times, and improve user satisfaction. In this post, we’ll explore two architectures for integrating GenAI into platforms like ServiceNow: man-in-the-middle (human-in-the-loop) and agentic automation (autonomous AI agents).


    Why GenAI for ITSM?

    • Ticket overload: Teams handle hundreds of tickets daily, leading to burnout and delays.
    • Knowledge gaps: Agents struggle to find relevant solutions quickly.
    • Repetitive tasks: Manual triage and updates consume valuable time.

    GenAI can automate classification, suggest solutions, and even resolve incidents-but how you integrate it matters. Let’s compare two approaches.


    Architecture 1: Man-in-the-Middle (Human-in-the-Loop)

    In this approach, GenAI acts as an assistant to human agents. It analyzes tickets, suggests actions, and automates tasks but requires human approval before execution.

    Workflow Diagram:

    Use Cases:

    • High-risk scenarios (e.g., critical infrastructure changes).
    • Compliance-heavy environments (e.g., healthcare, finance).

    Implementation Steps:

    1. Set Up ServiceNow Outbound REST Integration (javascript)

    // ServiceNow Scripted REST API (Outbound)
    var request = new sn_ws.RESTMessageV2();
    request.setEndpoint('https://your-middleware.com/process-ticket');
    request.setHttpMethod('POST');
    request.setRequestBody(JSON.stringify(current));
    var response = request.execute();

    2. Build Middleware (Python/Flask Example)

    from flask import Flask, request, jsonify
    import openai

    app = Flask(__name__)
    openai.api_key = "your-api-key"

    @app.route('/process-ticket', methods=['POST'])
    def handle_ticket():
    ticket_data = request.json

    # GenAI analysis
    prompt = f"""
    Classify this ITSM ticket and suggest priority (Critical/High/Medium/Low):
    Title: {ticket_data['short_description']}
    Description: {ticket_data['description']}
    """

    response = openai.ChatCompletion.create(
    model="gpt-4",
    messages=[{"role": "user", "content": prompt}]
    )

    suggestion = response.choices[0].message['content']
    return jsonify({"suggestion": suggestion, "ticket_id": ticket_data['number']})

    3. Human Review & Action
    Agents review GenAI’s suggestions in a dashboard and approve/reject them.


    Architecture 2: GenAI Agentic Automation

    Here, GenAI agents act autonomously within guardrails. They analyze tickets, execute actions (e.g., resolving incidents, updating KBs), and only escalate exceptions to humans.

    Workflow Diagram:

    Use Cases:

    • Low-risk, repetitive tasks (e.g., password resets, FAQ responses).
    • High-volume environments needing 24/7 support.

    Implementation Steps:

    1. Autonomous Ticket Resolution with Python

    import requests
    import openai

    def resolve_ticket_automatically(ticket_id):
    # Fetch ticket from ServiceNow
    snow_url = f"https://instance.service-now.com/api/now/table/incident/{ticket_id}"
    headers = {"Accept": "application/json"}
    auth = ("admin", "password")
    response = requests.get(snow_url, headers=headers, auth=auth)
    ticket = response.json()['result']

    # GenAI analysis
    prompt = f"""
    Resolve this ticket autonomously if possible. Provide a solution and mark as closed.
    Ticket: {ticket['description']}
    """

    ai_response = openai.ChatCompletion.create(
    model="gpt-4",
    messages=[{"role": "user", "content": prompt}]
    )

    # Auto-resolve if confidence is high
    if "reset password" in ai_response.choices[0].message['content'].lower():
    update_data = {
    "state": "6", # Resolved
    "close_notes": "Automatically resolved: Password reset instructions sent."
    }
    requests.patch(snow_url, json=update_data, headers=headers, auth=auth)

    2. Guardrails for Safety

    • Limit permissions (e.g., agents can’t modify user roles).
    • Log all actions for auditing.
    • Escalate tickets containing keywords like “outage” or “data breach” to humans.

    Key Considerations

    Combined Architecture Diagram:


    Best Practices for Both Architectures

    • Data Privacy: Mask PII/PHI in tickets before sending to GenAI APIs.
    • Feedback Loops: Let agents rate AI suggestions to improve models.
    • Tooling: Use frameworks like LangChain for complex workflows.

    Conclusion

    Whether you choose man-in-the-middle or agentic automation depends on your risk tolerance and use case. Start with a hybrid approach: use autonomous agents for simple tasks (e.g., FAQs) and human-in-the-loop for critical workflows. As trust in the system grows, expand automation cautiously.

    GenAI is set to redefine ITSM, propelling organizations from automation to true intelligence. The journey is just beginning-those who embrace this shift will not only optimize IT operations but also unlock new levels of agility, resilience, and innovation. The future of ITSM is not just faster or cheaper-it’s smarter, more adaptive, and profoundly more human.

  • Keep a container alive to troubleshoot it

    Containers are a great way to package code and dependencies in a portable package. This is fantastic in a world where dependencies keep getting bigger and more complex. But we are not here to discuss their benefits. If Google brought you here, more than likely you know already what a container is and you are trying to troubleshoot one. If that’s the case, I hope you find useful the tip I am about to tell you.

    To understand the solution we must first remember that containers are designed to run a task as soon as they start. You define such task with either CMD or ENTRYPOINT. The problem is that if the task dies the container dies too and you can’t log in into it to find out what happened. Sometimes “docker logs” will give you a hint of what’s happening but other times you wish you could simply log in to the container and check things out, but of course you can’t because the container is dead

    A solution I have become fond of is to override the ENTRYPOINT with a process that keeps the container alive and then open a terminal session into it. Let me give you an example.

    IMPORTANT: I am using Podman but all of this will work perfectly fine with Docker as well. This is the “Dockerfile“. Notice how the main task for this container is “python app.py

    FROM python:3.10.5
    WORKDIR /app
    COPY . /app
    RUN pip install --no-cache-dir -r requirements.txt
    EXPOSE 7860
    CMD ["python", "app.py"]

    This is the code contained in “app.py“. It is a simple Gradio chatbot. It gets the users prompt and sends an API call to to get a response.

    import gradio as gr
    import os, requests, import urllib3
    urllib3.disable_warnings()
    
    appurl = os.environ["APP_URL"]
    
    def give_response(query, history):
        payload = {"query": query}
        response = requests.post(appurl, json=payload)
        return response.json()["response"]
    
    demo = gr.ChatInterface(
                  give_response,
                  type = "messages",
                  title="My first Chatbot",
                  description="Ask me a question, don't be shy")
    
    demo.launch(server_name="0.0.0.0")

    As you can see the code requires us to define an environment variable “APP_URL” with the URL to send the request to. Let’s say that we don’t define the variable and attempt to run the container.

    pi@piper1:~$ podman run -d -p 7860:7860 localhost/blog:v1
    19dc02db0b2e06c51756c7f55a3eb861c11f831a21574efdcd2e00081c9191a1
    pi@piper1:~$ podman ps -a
    CONTAINER ID  IMAGE              COMMAND        CREATED        STATUS      NAMES
    19dc02db0b2e  localhost/blog:v1  python app.py  3 seconds ago  Exited (1)  dry_rice

    As expected the container fails but here is the trick … we run it again but we use the “–entrypoint” argument to run “tail -f /dev/null“. The container is not changing we are simply overriding “python app.py” with this “tail” command which stays running and in doing so keeps the container alive. Notice the “single quote” around the square brackets.

    pi@piper1:~$ podman run -d --entrypoint='["tail", "-f", "/dev/null"]' -p 7860:7860 localhost/blog:v1
    e1031d4c2ecbf3d4ec244aef262e71fb2f4e227154b6e22eabf634e4e053f4a0
    pi@piper1:~$ podman ps
    CONTAINER ID  IMAGE              STATUS        PORTS                   NAMES
    e1031d4c2ecb  localhost/blog:v1  Up 6 seconds  0.0.0.0:7860->7860/tcp  sour_soup

    Now we can login into the container and do whatever checks we need to do. We can even run “python app.py” and see what’s going on live.

    pi@piper1:~$ podman exec -it e1031d4c2ecb /bin/bash
    root@e1031d4c2ecb:/app# ls -l
    total 12
    -rw-r--r-- 1 root root 518 Mar 24 04:35 Dockerfile
    -rw-r--r-- 1 root root 566 Mar 24 04:35 app.py
    -rw-r--r-- 1 root root 897 Mar 24 04:35 requirements.txt
    root@e1031d4c2ecb:/app# python3 app.py
    Traceback (most recent call last):
      File "/app/app.py", line 7, in <module>
        appurl = os.environ["APP_URL"]
      File "/usr/local/lib/python3.10/os.py", line 679, in __getitem__
        raise KeyError(key) from None
    KeyError: 'APP_URL'

    This was a simplistic example but you get point. There could be a file or a path missing, a typo, a permissions issue … by using this trick you can troubleshoot interactively inside the container. Once you know what the issue is you can fix your files and rebuild the container image.

    The next question is, can you do this in Kubernetes as well? Yes, you can add the “command” to the “Deployment”, not to the “Pod”. This is a list of strings as you see in the last line in the simplified manifest below.

    apiVersion: v1
    kind: Deployment
    metadata:
      name: blog
    spec:
      containers:
      - name: blog-container
        image: debian
        command: ["tail", "-f", "/dev/null"]

    As soon as I save the changes to the deployment manifest, Openshift creates a new pod and kills the old one. Then I can terminal into the new pod and browse around. Notice I can even launch the application from the terminal session.

    $ pwd         
    /app
    $ ls -l
    total 12
    -rw-r--r--. 1 root root 518 Mar 24 04:35 Dockerfile
    -rw-r--r--. 1 root root 566 Mar 24 04:35 app.py
    -rw-r--r--. 1 root root 897 Mar 24 04:35 requirements.txt
    $ ps -ef
    UID          PID    PPID  C STIME TTY          TIME CMD
    1000770+       1       0  0 00:00 ?        00:00:00 tail -f /dev/null
    1000770+       7       0  0 00:00 pts/0    00:00:00 sh -i -c TERM=xterm sh
    1000770+      13       7  0 00:00 pts/0    00:00:00 sh
    1000770+      90      13  0 00:02 pts/0    00:00:00 ps -ef
    
    $ python3 app.py
    * Running on local URL:  http://0.0.0.0:7860
    
    To create a public link, set `share=True` in `launch()`.

    Of course, this is only intended for troubleshooting. Once you find out what’s wrong you can fix the image and manifest and deploy them again.

  • Podman build fails with /etc/passwd: permission denied

    A short post today to share an issue that troubled me for a while. Hopefully it can help you too.

    Basically I was trying to build a new container image using Podman in Ubuntu. These are my versions:

    • Ubuntu 24.04.2 LTS
    • podman version 4.9.3

    My Dockerfile is straight forward

    FROM python:3.10.5
    WORKDIR /app
    COPY . /app
    RUN pip install --no-cache-dir -r requirements.txt
    CMD ["python", "app.py"]

    When I tried to create the container image I get the following output

    (env) user1@mytpl:~/Desktop/myapp$ podman build -t myapp:v1 .
    STEP 1/6: FROM python:3.10.5
    Resolved "python" as an alias (/etc/containers/registries.conf.d/shortnames.conf)
    Trying to pull docker.io/library/python:3.10.5...
    Getting image source signatures
    Copying blob 588423e31bcf done   |
    Copying blob 001c52e26ad5 done   |
    Copying blob 2068746827ec done   |
    Copying blob d9d4b9b6e964 done   |
    Copying blob 8a335986117b done   |
    Copying blob 9daef329d350 done   |
    Copying blob ecb6a3f01c0d done   |
    Copying blob 00d40f20f0cf done   |
    Copying blob 5d588b4f3b55 done   |
    Error: creating build container: copying system image from manifest list: writing blob: adding layer with blob "sha256:001c52e26ad57e3b25b439ee0052f66           92e5c0f2d5d982a00a8819ace5e521452": processing tar file(open /etc/passwd: permission denied): exit status 1

    In the end I tracked it down to a service called “mfetpd.service” which appears to be some Trellix endpoint security software.

    (env) user1@mytpl:~/Desktop/myapp$ sudo systemctl status mfetpd.service
    ● mfetpd.service - Trellix Endpoint Security for Linux Threat Prevention
         Loaded: loaded (/usr/lib/systemd/system/mfetpd.service; enabled; preset: enabled)
         Active: active (running) since Mon 2025-03-24 14:35:44 +08; 5min ago
           Docs: man:mfetpd(8)
        Process: 30546 ExecStartPre=/opt/McAfee/ens/tp/scripts/aac-control-wrapper.sh systemd (code=exited, status=0/SUCCESS

    The solution was to temporarily stop this service to build the container image

    sudo systemctl stop mfetpd.service
    podman build ...
    sudo systemctl start mfetpd.service

    Once the image “python:3.10.5” layer is downloaded I am able to build more containers using the same version of Python without having to pause the “mfetpd” service which makes my security team happy.

    I hope this helps you same some of your precious time!

  • Infrastructure as Code (IaC) Security Best Practices

    Infrastructure as Code (IaC) Security Best Practices

    Infrastructure as Code (IaC) has revolutionized how we provision and manage infrastructure, enabling speed, repeatability, and scalability. However, as with any code, IaC introduces new security considerations. Misconfigurations, exposed secrets, and lack of visibility can lead to significant risks in production environments.

    This guide explores actionable best practices for securing your Terraform, Ansible, and other IaC pipelines-helping you build robust, compliant, and resilient infrastructure. Sample code and how-to notes included!


    1. Treat IaC Like Application Code

    Just as you would with application code, store your IaC in version control systems (e.g., Git). This enables:

    • Change tracking: Who changed what, when, and why.
    • Peer reviews: Enforce code reviews and approvals before merging.
    • Rollback: Revert to previous known-good states if issues arise.

    Tip:
    Use branch protection rules and require pull request reviews for all changes.


    2. Secrets Management

    Never hard-code secrets or sensitive data (API keys, passwords, certificates) in your IaC files. Instead:

    • Use secret management tools like HashiCorp Vault, AWS Secrets Manager, or Azure Key Vault.
    • Integrate secrets into your pipelines at runtime, not in code.
    • Leverage environment variables or encrypted files for sensitive values.

    Sample: Fetching Secrets from Vault in Terraform

    provider "vault" {
      address = "https://vault.example.com"
    }
    
    resource "vault_generic_secret" "example" {
      path = "secret/data/myapp"
    }
    
    output "db_password" {
      value = vault_generic_secret.example.data["password"]
    }

    How-to:

    • Replace https://vault.example.com with your Vault server address.
    • The vault_generic_secret resource fetches secrets dynamically.
    • Output blocks can reference secrets securely-never hardcode them!

    Sample: Encrypting Secrets in Ansible with ansible-vault

    - hosts: all
      vars_files:
        - secrets.yml
      tasks:
        - name: Use secret password
          debug:
            msg: "The password is {{ secret_password }}"

    How-to:

    • Create and encrypt the secrets file: ansible-vault create secrets.yml
    • Reference the encrypted file in your playbook under vars_files.
    • Access secrets in tasks using Jinja2 templating, e.g., {{ secret_password }}.

    3. Automated Security Scanning

    Integrate security tools into your CI/CD pipeline to catch misconfigurations and vulnerabilities early:

    Sample: Terraform Security Scanning with tfsec in GitHub Actions

    name: Terraform Security Scan
    
    on: [push]
    
    jobs:
      tfsec:
        runs-on: ubuntu-latest
        steps:
          - uses: actions/checkout@v2
          - name: Run tfsec
            uses: aquasecurity/tfsec-action@v1
            with:
              tfsec_version: 'latest'

    How-to:

    • Add this workflow to your .github/workflows directory.
    • The scan will fail the build if critical security issues are found, helping you catch problems early.

    4. Principle of Least Privilege

    Ensure that your IaC tools, pipelines, and the resources they provision follow the principle of least privilege:

    • Limit IAM permissions for automation accounts.
    • Avoid using overly broad roles or root accounts.
    • Regularly audit permissions and remove unnecessary access.

    5. Policy as Code

    Define and enforce security and compliance policies programmatically:

    • Use tools like Open Policy Agent (OPA), Sentinel (for Terraform Cloud), or Conftest.
    • Enforce rules such as “no public S3 buckets,” “encryption enabled,” or “no hardcoded credentials.”

    Example:
    OPA policies can block deployments that violate security standards before they reach production.


    6. Continuous Monitoring and Drift Detection

    Even after deployment, infrastructure can drift from the desired state:

    • Use tools like Terraform Cloud, AWS Config, or Driftctl to detect and remediate drift.
    • Set up alerts for unauthorized changes and automate remediation where possible.

    7. Regular Reviews and Updates

    IaC modules and dependencies evolve-so should your security practices:

    • Schedule regular reviews of your IaC codebase and third-party modules.
    • Update modules to patch vulnerabilities and leverage new security features.
    • Document your security practices and train your team.

    Conclusion

    Securing Infrastructure as Code is not a one-time task, but a continuous process woven into your development and deployment lifecycle. By treating IaC like application code, managing secrets securely, automating scanning, enforcing least privilege, and using policy as code, you can drastically reduce risk and build trust in your automation.

  • Using Ansible to run Terraform plans

    Yes, your eyes are not deceiving you 🙂 Usually, when the words Ansible and Terraform appear in the same sentence is for the opposite scenario. Many articles out there provide examples of using Terraform to deploy infrastructure followed by running Ansible to configure it using the local-exec provisioner. This is a good thing because, if you need some post-provisioning configuration, it is better to rely on another declarative and idempotent tool like Ansible, rather than invoking shell scripts.

    But in this post we are not going to do any of that. What we are going to do is the other way around. We are going to have an Ansible playbook that runs your Terraform plan.

    This article is a follow up from a series of posts to introduce infrastructure admins and engineers to Terraform and to explain how to use it to manage on-prem physical infrastructure in a datacenter. You can find access the full series here.

    Reasons to do it

    But why? Well, if you have an physical infrastructure background and are running a traditional datacenter more than likely you have been playing with Ansible. Chances are you started with Ansible running in the command line and hard-coding your infrastructure’s credentials inside the playbook. Then you evolved into using an external credentials file and encrypting it using “ansible-vault”. Eventually you might have deployed Ansible AWX or even RedHat AAP. At this point, you are enjoying RBAC (who can run what playbook and on what infrastructure) and amazing (there is no other way to put it) credential management.

    Then, you talk to your developers over coffee and they tell you about Terraform. But when you get familiar with it, you discover that unless you pay for a SaaS offering you are stuck in the “command-line with hard-coded credentials” scenario. Wouldn’t it be great if you could use AWX to run Terraform? You could enjoy RBAC and credential management and all the other goodness that it provides. This is possible thanks to Ansible’s Terraform module.

    First steps

    Let’s say we have a very basic Terraform project to create a storage group in Dell PowerMax. The “main.tf” shown below starts the PowerMax provider and then creates a storage group “terraform_sg”. I don’t think it is strictly necessary, but if you are interested in learning more about provisioning storage in Dell PowerMax you can check out this previous post. For simplicity we haven’t created or referenced any variables. All the information is contained into a single file, the “main.tf” shown below.

    terraform {
      required_providers {
        powermax = {
          source = "dell/powermax"
        }
      }
    }
    
    provider "powermax" {
      username      = "smc"
      password      = "TFp2ssw0rd"
      endpoint      = "https://10.1.2.3:8443"
      serial_number = "000123456789"
      pmax_version  = 100
      insecure      = true
    }
    
    resource "powermax_storagegroup" "tf_sg" {
      name          = "terraform_sg"
      srp_id         = "SRP_1"
    }

    In the same machine we have both Terraform and Ansible installed. In order to run the above Terraform plan with Ansible, we need at a minimum a playbook that looks like follows. It needs to include two mandatory parameters: “project_path” and “state”. The first parameter specifies the directory that contains the plan, ie the “main.tf” and typically any other files like “variables.tf”. My Ansible playbook is called “runtf.yml”.

    ---
    - hosts: localhost
      gather_facts: no
    
      vars:
        project_dir: "/root/powermax" # folder that contains main.tf, ...
    
      tasks:
        - name: Run terraform
          community.general.terraform:
            project_path: '{{ project_dir }}'
            state: present
          register: output
    
        - debug:
            var: output

    As you can see I have registered the output of the terraform task and then created a second task to print it out on the terminal so that we can get more details. All is left now is to run it using the “ansible-playbook” command

    root@alb-terraform:~# ansible-playbook runtf.yml
    
    PLAY [localhost] ***************************************************************************************
    
    TASK [Run terraform] ***************************************************************************************
    changed: [localhost]
    
    TASK [debug] ***************************************************************************************
    ok: [localhost] => {
        "output": {
            "changed": true,
            "command": "/usr/bin/terraform apply -no-color -input=false -auto-approve -lock=true /tmp/tmpjaojemdl.tfplan",
            "failed": false,
            "outputs": {},
            "state": "present",
            "stderr": "",
            "stderr_lines": [],
            "stdout": "powermax_storagegroup.tf_sg: Creating...\npowermax_storagegroup.tf_sg: Creation complete after 0s [id=terraform_sg]\n\nApply complete! Resources: 1 added, 0 changed, 0 destroyed.\n",
            "stdout_lines": [
                "powermax_storagegroup.tf_sg: Creating...",
                "powermax_storagegroup.tf_sg: Creation complete after 0s [id=terraform_sg]",
                "",
                "Apply complete! Resources: 1 added, 0 changed, 0 destroyed."
            ],
            "workspace": "default"
        }
    }
    
    PLAY RECAP ***************************************************************************************
    localhost  : ok=2    changed=1    unreachable=0    failed=0    skipped=0    ignored=0

    Ansible run Terraform, and Terraform managed to make the changes so as expected, Ansible reports the task as “changed”. In the “debug” task, notice the “command” parameter. This is how Ansible is invoking Terraform. This invocation includes the “-auto-approve” flag so that Terraform doesn’t look for confirmation. The “stdout” and stdout_lines” parameters show the output that has been captured from Terraform about the creation of the different resources .

    A very important feature of both Ansible and Terraform is idempotency, ie the ability to run the same code repeatedly without making any damage. Let’s run it again and observe what happens.

    root@alb-terraform:~# ansible-playbook runtf.yml
    
    PLAY [localhost] ***************************************************************************************
    
    TASK [Run terraform] ***************************************************************************************
    ok: [localhost]
    
    TASK [debug] ***************************************************************************************
    ok: [localhost] => {
        "output": {
            "changed": false,
            "command": "/usr/bin/terraform apply -no-color -input=false -auto-approve -lock=true /tmp/tmp718kkwbo.tfplan",
            "failed": false,
            "outputs": {},
            "state": "present",
            "stderr": "",
            "stderr_lines": [],
            "stdout": "powermax_storagegroup.tf_sg: Refreshing state... [id=terraform_sg]\n\nNo changes. Your infrastructure matches the configuration.\n\nTerraform has compared your real infrastructure against your configuration\nand found no differences, so no changes are needed.\n",
            "stdout_lines": [
                "powermax_storagegroup.tf_sg: Refreshing state... [id=terraform_sg]",
                "",
                "No changes. Your infrastructure matches the configuration.",
                "",
                "Terraform has compared your real infrastructure against your configuration",
                "and found no differences, so no changes are needed."
            ],
            "workspace": "default"
        }
    }
    
    PLAY RECAP ***************************************************************************************
    localhost : ok=2    changed=0    unreachable=0    failed=0    skipped=0     ignored=0
    

    As expected, Ansible is reporting “ok”, which means the current state matched the desired state and therefore no changes were made. It has also captured the relevant from Terraform stating the same thing.

    Using variables

    This is a good start but ideally we would like to have the ability to make the plan more flexible by using variables for information such as the storage group name in this case. We can modify the “main.tf” as follows. Notice how the “default” value of the variable is commented out. It doesn’t matter if it is commented or not because when we invoke Terraform with external variables we overwrite the default value defined in the variable blocks.

    terraform {
      required_providers {
        powermax = {
          source = "dell/powermax"
        }
      }
    }
    
    provider "powermax" {
      username      = "smc"
      password      = var.password
      endpoint      = "https://10.1.2.3:8443"
      serial_number = "000123456789"
      pmax_version  = 100
      insecure      = true
    }
    
    variable "sg_name" {
     description = "Name of volume to create"
     type        = string
     #default     = "terraform_sg"
    }
    
    variable "password" {
      type        = string
      description = "Stores the password of Unisphere."
      #default = ""
    }
    
    resource "powermax_storagegroup" "tf_sg" {
      name          = var.sg_name
      srp_id         = "SRP_1"
    }

    Additionally, notice how in the “provider” block we have also referenced another variable for the “password”. For security reasons we might want to have, sensitive information like that, stored in a separate file and protect it. In this case we haven’t even declared a default value because we can leverage ansible-vault or AWX to encrypt it and to pass it to Terraform at run time.

    Now, the corresponding Ansible playbook needs to use the “variables” parameter. This parameter essentially converts each of the variables into a “-var” flag when invoking Terraform.

    ---
    - hosts: localhost
      gather_facts: no
    
      vars:
        project_dir: "/root/powerstore" # folder that contains main.tf, ...
    
      tasks:
        - name: Run terraform
          community.general.terraform:
            project_path: '{{ project_dir }}'
            state: present
            variables:
              sg_name: "{{ vol_name }}"
              password: "{{ password }}"
          register: output
    
        - debug:
            var: output

    Now, at runtime we are going to select a different storage group name. The storage group is created as expected and the relevant Terraform output is captured.

    root:~# ansible-playbook runtf.yml --extra-vars "sg_name=tf-sg2 password=TFp2ssw0rd"
    
    PLAY [localhost] ***************************************************************************************
    
    TASK [Run terraform] ***************************************************************************************
    changed: [localhost]
    
    TASK [debug] ***************************************************************************************
    ok: [localhost] => {
        "output": {
            "changed": true,
            "command": "/usr/bin/terraform apply -no-color -input=false -auto-approve -lock=true /tmp/tmpimdwzdu1.tfplan",
            "failed": false,
            "outputs": {},
            "state": "present",
            "stderr": "",
            "stderr_lines": [],
            "stdout": "powermax_storagegroup.tf_sg: Creating...\npowermax_storagegroup.tf_sg: Creation complete after 5s [id=vol1]\n\nApply complete! Resources: 1 added, 0 changed, 0 destroyed.\n",
            "stdout_lines": [
                "powermax_storagegroup.tf_sg: Creating...",
                "powermax_storagegroup.tf_sg: Creation complete after 5s [id=vol1]",
                "",
                "Apply complete! Resources: 1 added, 0 changed, 0 destroyed."
            ],
            "workspace": "default"
        }
    }
    
    PLAY RECAP ***************************************************************************************
    localhost  : ok=2    changed=1    unreachable=0    failed=0    skipped=0    ignored=0

    Terraform plan

    We went straight to “terraform apply” but most Terraform workflows also include running the plan command first. This is done with Ansible by running the playbook in “check mode”. Check mode invokes “terraform plan” for us.

    root:~# ansible-playbook runtf.yml --check --extra-vars "sg_name=tf-sg3 password=TFpass"
    
    PLAY [localhost] ***************************************************************************************
    
    TASK [Run terraform] ***************************************************************************************
    ok: [localhost]
    
    TASK [debug] ***************************************************************************************
    ok: [localhost] => {
        "output": {
            "changed": false,
            "command": "/usr/bin/terraform apply -no-color -input=false -auto-approve -lock=true /tmp/tmp6f2o83k5.tfplan",
            "failed": false,
            "outputs": {},
            "state": "present",
            "stderr": "",
            "stderr_lines": [],
            "stdout": "powermax_storagegroup.tf_sg: Refreshing state... [id=tf-sg2]\n\nTerraform used the selected providers to generate the following execution\nplan. Resource actions are indicated with the following symbols:\n  ~ update in-place\n\nTerraform will perform the following actions:\n\n  # powermax_storagegroup.tf_sg will be updated in-place\n  ~ resource \"powermax_storagegroup\" \"tf_sg\" {\n      ~ cap_gb                   = 0 -> (known after apply)\n      + child_storage_group      = (known after apply)\n      ~ compression              = true -> (known after apply)\n      + compression_ratio        = (known after apply)\n      ~ compression_ratio_to_one = 0 -> (known after apply)\n      + device_emulation         = (known after apply)\n      ~ id                       = \"tf-sg2\" -> (known after apply)\n      + maskingview              = (known after apply)\n      ~ name                     = \"tf-sg2\" -> \"tf-sg3\"\n      ~ num_of_child_sgs         = 0 -> (known after apply)\n      ~ num_of_masking_views     = 0 -> (known after apply)\n      ~ num_of_parent_sgs        = 0 -> (known after apply)\n      + num_of_snapshot_policies = (known after apply)\n      ~ num_of_snapshots         = 0 -> (known after apply)\n      ~ num_of_vols              = 0 -> (known after apply)\n      + parent_storage_group     = (known after apply)\n      + service_level            = (known after apply)\n      ~ slo                      = \"NONE\" -> (known after apply)\n      ~ slo_compliance           = \"NONE\" -> (known after apply)\n      + snapshot_policies        = (known after apply)\n      + tags                     = (known after apply)\n      ~ type                     = \"Standalone\" -> (known after apply)\n      ~ unprotected              = true -> (known after apply)\n      ~ unreducible_data_gb      = 0 -> (known after apply)\n      + uuid                     = (known after apply)\n      ~ volume_ids               = [] -> (known after apply)\n      + vp_saved_percent         = (known after apply)\n      + workload                 = (known after apply)\n        # (2 unchanged attributes hidden)\n    }\n\nPlan: 0 to add, 1 to change, 0 to destroy.\n\n─────────────────────────────────────────────────────────────────────────────\n\nSaved the plan to: /tmp/tmp6f2o83k5.tfplan\n\nTo perform exactly these actions, run the following command to apply:\n    terraform apply \"/tmp/tmp6f2o83k5.tfplan\"\n",
            "stdout_lines": [
                "powermax_storagegroup.tf_sg: Refreshing state... [id=tf-sg2]",
                "",
                "Terraform used the selected providers to generate the following execution",
                "plan. Resource actions are indicated with the following symbols:",
                "  ~ update in-place",
                "",
                "Terraform will perform the following actions:",
                "",
                "  # powermax_storagegroup.tf_sg will be updated in-place",
                "  ~ resource \"powermax_storagegroup\" \"tf_sg\" {",
                "      ~ cap_gb                   = 0 -> (known after apply)",
                "      + child_storage_group      = (known after apply)",
                "      ~ compression              = true -> (known after apply)",
                "      + compression_ratio        = (known after apply)",
                "      ~ compression_ratio_to_one = 0 -> (known after apply)",
                "      + device_emulation         = (known after apply)",
                "      ~ id                       = \"tf-sg2\" -> (known after apply)",
                "      + maskingview              = (known after apply)",
                "      ~ name                     = \"tf-sg2\" -> \"tf-sg3\"",
                "      ~ num_of_child_sgs         = 0 -> (known after apply)",
                "      ~ num_of_masking_views     = 0 -> (known after apply)",
                "      ~ num_of_parent_sgs        = 0 -> (known after apply)",
                "      + num_of_snapshot_policies = (known after apply)",
                "      ~ num_of_snapshots         = 0 -> (known after apply)",
                "      ~ num_of_vols              = 0 -> (known after apply)",
                "      + parent_storage_group     = (known after apply)",
                "      + service_level            = (known after apply)",
                "      ~ slo                      = \"NONE\" -> (known after apply)",
                "      ~ slo_compliance           = \"NONE\" -> (known after apply)",
                "      + snapshot_policies        = (known after apply)",
                "      + tags                     = (known after apply)",
                "      ~ type                     = \"Standalone\" -> (known after apply)",
                "      ~ unprotected              = true -> (known after apply)",
                "      ~ unreducible_data_gb      = 0 -> (known after apply)",
                "      + uuid                     = (known after apply)",
                "      ~ volume_ids               = [] -> (known after apply)",
                "      + vp_saved_percent         = (known after apply)",
                "      + workload                 = (known after apply)",
                "        # (2 unchanged attributes hidden)",
                "    }",
                "",
                "Plan: 0 to add, 1 to change, 0 to destroy.",
                "",
                "─────────────────────────────────────────────────────────────────────────────",
                "",
                "Saved the plan to: /tmp/tmp6f2o83k5.tfplan",
                "",
                "To perform exactly these actions, run the following command to apply:",
                "    terraform apply \"/tmp/tmp6f2o83k5.tfplan\""
            ],
            "workspace": "default"
        }
    }
    
    PLAY RECAP ***************************************************************************************
    localhost   : ok=2    changed=0    unreachable=0    failed=0    skipped=0    ignored=0

    No changes are made and the Ansible module has captured the details of the changes that will be made if the plan is applied.

    Terraform destroy

    Finally we need to learn how to use “terraform destroy”. You might have guessed it by now. The native way of destroying something in Ansible is by setting the state to “absent”.

    ---
    - hosts: localhost
      gather_facts: no
    
      vars:
        project_dir: "/root/powermax" # dir that contains main.tf, ...
    
      tasks:
        - name: Run terraform
          community.general.terraform:
            project_path: '{{ project_dir }}'
            state: absent
            variables:
              sg_name: "{{ sg_name }}"
              password: "{{ password }}"
          register: output
    
        - debug:
            var: output

    Let’s run it and see what it does.

    root:~# ansible-playbook runtf.yml --extra-vars "sg_name=tf-sg2 password=TFp2ssw0rd"
    
    PLAY [localhost] ***************************************************************************************
    
    TASK [Run terraform] ***************************************************************************************
    changed: [localhost]
    
    TASK [debug] ***************************************************************************************
    ok: [localhost] => {
        "output": {
            "changed": true,
            "command": "/usr/bin/terraform destroy -no-color -auto-approve -lock=true -var sg_name=tf-sg2 -var password=smc",
            "failed": false,
            "outputs": {},
            "state": "absent",
            "stderr": "",
            "stderr_lines": [],
            "stdout": "powermax_storagegroup.tf_sg: Refreshing state... [id=tf-sg2]\n\nTerraform used the selected providers to generate the following execution\nplan. Resource actions are indicated with the following symbols:\n  - destroy\n\nTerraform will perform the following actions:\n\n  # powermax_storagegroup.tf_sg will be destroyed\n  - resource \"powermax_storagegroup\" \"tf_sg\" {\n      - cap_gb                   = 0 -> null\n      - compression              = true -> null\n      - compression_ratio_to_one = 0 -> null\n      - host_io_limit            = {} -> null\n      - id                       = \"tf-sg2\" -> null\n      - name                     = \"tf-sg2\" -> null\n      - num_of_child_sgs         = 0 -> null\n      - num_of_masking_views     = 0 -> null\n      - num_of_parent_sgs        = 0 -> null\n      - num_of_snapshots         = 0 -> null\n      - num_of_vols              = 0 -> null\n      - slo                      = \"NONE\" -> null\n      - slo_compliance           = \"NONE\" -> null\n      - srp_id                   = \"SRP_1\" -> null\n      - type                     = \"Standalone\" -> null\n      - unprotected              = true -> null\n      - unreducible_data_gb      = 0 -> null\n      - volume_ids               = [] -> null\n    }\n\nPlan: 0 to add, 0 to change, 1 to destroy.\npowermax_storagegroup.tf_sg: Destroying... [id=tf-sg2]\npowermax_storagegroup.tf_sg: Destruction complete after 0s\n\nDestroy complete! Resources: 1 destroyed.\n",
            "stdout_lines": [
                "powermax_storagegroup.tf_sg: Refreshing state... [id=tf-sg2]",
                "",
                "Terraform used the selected providers to generate the following execution",
                "plan. Resource actions are indicated with the following symbols:",
                "  - destroy",
                "",
                "Terraform will perform the following actions:",
                "",
                "  # powermax_storagegroup.tf_sg will be destroyed",
                "  - resource \"powermax_storagegroup\" \"tf_sg\" {",
                "      - cap_gb                   = 0 -> null",
                "      - compression              = true -> null",
                "      - compression_ratio_to_one = 0 -> null",
                "      - host_io_limit            = {} -> null",
                "      - id                       = \"tf-sg2\" -> null",
                "      - name                     = \"tf-sg2\" -> null",
                "      - num_of_child_sgs         = 0 -> null",
                "      - num_of_masking_views     = 0 -> null",
                "      - num_of_parent_sgs        = 0 -> null",
                "      - num_of_snapshots         = 0 -> null",
                "      - num_of_vols              = 0 -> null",
                "      - slo                      = \"NONE\" -> null",
                "      - slo_compliance           = \"NONE\" -> null",
                "      - srp_id                   = \"SRP_1\" -> null",
                "      - type                     = \"Standalone\" -> null",
                "      - unprotected              = true -> null",
                "      - unreducible_data_gb      = 0 -> null",
                "      - volume_ids               = [] -> null",
                "    }",
                "",
                "Plan: 0 to add, 0 to change, 1 to destroy.",
                "powermax_storagegroup.tf_sg: Destroying... [id=tf-sg2]",
                "powermax_storagegroup.tf_sg: Destruction complete after 0s",
                "",
                "Destroy complete! Resources: 1 destroyed."
            ],
            "workspace": "default"
        }
    }
    
    PLAY RECAP ***************************************************************************************
    localhost  : ok=2    changed=1    unreachable=0    failed=0    skipped=0     ignored=0

    The storage group resource has been destroyed and that shows in Ansible as a task with a status of “changed”. The “stdout” and “stdout_lines” parameters provide a record of what was destroyed.

    In summary, in this article we have seen how to use the terraform Ansible module to plan, apply and destroy Terraform projects. In doing that, organizations can leverage a tool like AWX or RedHat AAP to provide RBAC, strong credential management and a powerful upstream REST API and integrate with other tools like ITSM etc. AWX and AAP can also became a polyglot automation platform capable of running the two most popular automation tools out there to satisfy both traditional infrastructure teams and developers.

  • Exploring the Strengths and Trade-offs of Fine-tuning and RAG in Language Models

    In the ever-evolving landscape of artificial intelligence, the incorporation of domain-specific knowledge into language models (LLMs) is not just a lofty goal—it’s a mission-critical aspect of model performance. This is where fine-tuning and Retriever-Reader (RAG) come into the picture, two powerful approaches with distinct methodologies for imbuing models with domain-specific prowess. As the Director of AI Research at a tech startup, investing in the right approach to empower language models with knowledge is a debate that rages on in our weekly strategy meetings. In this piece, I dissect the benefits and trade-offs of both methods, aiming to help data scientists, AI enthusiasts, and tech professionals make informed decisions regarding the enhancement of LLMs.

    Introduction

    The modern data scientist wields the power to curate a model’s understanding to an unprecedented degree. Incorporating domain knowledge has become less of an afterthought and more of the central piece to the puzzle of AI applications. As established models like GPT-3 demonstrate extraordinary capabilities, the question of specialized knowledge arises. Both fine-tuning and RAG have stepped forward as capable candidates for augmenting language models, offering different paths to the same destination.

    Fine-tuning: Leveraging Existing Models

    Fine-tuning involves starting with a pre-trained model and updating its weights using labeled examples from within the target domain. The rationale is simple: rather than reinventing the wheel, one can build upon the wealth of knowledge already stored within established models.

    https://sebastianraschka.com/images/blog/2023/llm-finetuning-llama-adapter/classic-flowchart.png

    The Fine-tuning Approach in Depth

    Fine-tuning has gained popularity due to its relatively lower resource consumption compared to training from scratch. Pre-trained models come with an inherent understanding of language and are adept at various natural language processing (NLP) tasks. By fine-tuning these models, often with a smaller, domain-specific dataset, we can specialize the general model to fit particular needs.

    Benefits of Fine-tuning

    • Faster Deployment: Leveraging an existing model allows for a quicker setup, reducing the time from development to deployment significantly.
    • Capitalizing on Pre-trained Weights: The pre-training phase is costly in terms of computation and time. Fine-tuning capitalizes on this investment, using pre-trained weights as a head start for domain tasks.
    • Leveraging Pre-Trained Models: Pre-trained models are increasingly sophisticated and capture various nuances of human language.

    Examples of Successful Applications

    The medical field, for instance, has seen strides with fine-tuned models specializing in entity recognition, question answering, and summarization tasks. In patient data analysis, these models can parse through vast amounts of unstructured text, extracting relevant information with precision.

    RAG: Incorporating Explicit Knowledge

    RAG, on the other hand, is a more recently introduced framework designed to incorporate external knowledge sources into the inference process. It aims to enhance the rationality and awareness of AI systems by allowing them to query reference materials as part of their preliminary thinking.

    The RAG Framework in Depth

    The RAG framework consists of two components: a retriever and a reader. The retriever uses a query to extract relevant passages from a knowledge source, and the reader processes these passages to find an answer or provide context.

    Image courtesy – https://lilianweng.github.io/posts/2020-10-29-odqa/

    Advantages of RAG

    • Handling Out-of-Domain Queries: RAG is capable of tackling a broader set of tasks, not just those within the dataset scope, by referring to the internet or other massive knowledge bases.
    • Interpretability: The retriever component offers insights into the knowledge basis of the model’s decisions, essential for accountability and trust in AI systems.

    Real-World Use Cases

    In legal research, for example, RAG models can sift through laws, cases, and precedents to provide up-to-date advice, cross-referencing information as legal landscapes shift. As such, the legal domain provides a fertile ground for RAG models to shine, reshaping how we approach legal queries and research.

    Strengths and Weaknesses of Fine-tuning

    Fine-tuning isn’t without its downsides. While it excels in many facets, particularly speed and leveraging existing models, it does come with concerns over model performance in unique domains.

    Discussion of the Strengths

    Fine-tuned models often achieve better performance on in-domain tasks, as they’ve been trained to recognize and respond to specific patterns and language nuances within the domain.

    Analysis of the Weaknesses

    Fine-tuned models can be sensitive to the distribution and quality of the training data. Overfitting, a common problem, may occur, leading to less generalizable models. Moreover, fine-tuning can inadvertently strip away some of the broader knowledge captured in the pre-training phase.

    Strengths and Weaknesses of RAG

    RAG’s ability to query large knowledge bases is a distinct advantage but not without its own set of challenges.

    Examination of the Strengths

    RAG models offer improved interpretability, particularly through the retriever’s explicit referencing of the source of its decisions. They also enjoy the benefit of not being overly specialized to a specific domain, serving as a more flexible solution.

    Analysis of the Weaknesses

    However, RAG’s computational requirements are significant. Each query necessitates running through a retrieval system, which can be a bottleneck in terms of the model’s scalability. There’s also the potential for errors in retrieving and parsing large external datasets.

    Trade-offs and Considerations

    When facing a decision between fine-tuning and RAG, it’s critical to assess the nuances of each approach and how they align with the project’s objectives and constraints.

    Comparison of the Two Approaches

    • Performance: Fine-tuned models often outperform RAG models on in-domain tasks. However, RAG’s ability to call upon external knowledge can provide a richer context and improve overall understanding.
    • Flexibility: RAG models are inherently more flexible, handling out-of-domain queries with ease. Fine-tuned models may struggle with tasks beyond their initial scope.
    • Resource Requirements: Fine-tuning generally requires fewer resources, both in terms of infrastructure and data. RAG, with its need for knowledge bases and retrieval systems, tends to be more resource-intensive.

    Factors to Consider

    Certain factors, such as the availability of domain-specific data, the tolerance for uncertainty in results, and the willingness to invest in computational power, should heavily influence the choice between these two approaches.

    Conclusion

    In navigating the complex terrain of domain knowledge incorporation in language models, our journey is one of constant assessment and adaptation. Both fine-tuning and RAG represent leading strategies, each replete with strengths and trade-offs. While there may be no one-size-fits-all answer, the key to unlocking the potential of AI systems lies in understanding and consciously selecting the tool that best suits the task at hand.

    As we stride forward, it’s clear that a balanced approach, perhaps even a hybrid of fine-tuning and RAG, could be the most promising direction. It’s incumbent upon us as practitioners to continue probing, experimenting, and pushing the boundaries of what is possible with language models. By doing so, we will not only elevate the efficiency of our AI systems but also deepen our understanding of what it truly means to teach machines with human wisdom.

    Investing in the right approach isn’t just about model performance; it’s about the ethical and practical implications of the choices we make in the burgeoning field of AI. The confluence of domain knowledge and language models is a domain ripe with potential, and as we integrate these methods into our systems, it will be exciting to see how they unfold, bringing us discoveries, better performance, and perhaps most importantly, a greater appreciation for the delicate art of AI model construction.

  • Ansible Dynamic Inventory Tutorial

    This is the first of a 3 part series on Ansible dynamic inventories. I was looking for some information about dynamic inventories as part of a project and I realized that even though there are a few articles out there, there is little detailed content specially around building your own dynamic inventory script and how to use it in Tower/AWX. So I am planning to share all the lessons I learned to help you in your own journey. This series is structured as follows:

    • Introduction to dynamic inventory
    • Develop your own dynamic inventory
    • Dynamic inventory in AWX/AAP

    The code for the examples shown in this series is written in Python and is available in this GitHub repo: https://github.com/cermegno/ansible-dynamic-inventory. And now, without further ado let’s start with the introduction.

    Static Inventory 1 min recap

    If you are reading this article more than likely you are not new to Ansible and you know what a static inventory is, but we need to spend a minute laying out the example we will use in this tutorial. Inventories can be formatted in several ways but INI is perhaps the most common. In an inventory you can define groups and children groups. The following is an example that shows 2 groups: “webprod” and “webdev”, each one with 2 target systems on it.

    [webprod]
    web1 http_port=123
    web2 http_port=456
    
    [webdev]
    dev1
    dev2
    
    [webdev:vars]
    user=admin
    pass=password
    

    You also have the ability to define variables for a group and for individual hosts. In this example we have defined a host variable for each host in the “webprod” group. However, the 2 variables we need for the “webdev” group are the same for all systems in that group so it makes sense to use group variables as shown.

    Another way you can format inventory files is JSON, and as we will see next, the JSON format is specially useful when creating dynamic inventories

    Understanding Dynamic Inventories

    Static files like these are the most common type of Ansible inventories and as long as the information contained in them doesn’t change often this is the way to go. However there are many environments that are very dynamic in nature and a static inventory file like this becomes obsolete very quickly and it is hard to maintain. So the solution is to use a dynamic inventory.

    Another consideration is that sometimes the targets themselves don’t change much but the variables (for hosts or groups) do. The use case we will play with in the second part of this tutorial is a great example of this.

    So, what is a dynamic inventory? It is a script that returns the inventory information in a specific format that Ansible expects. What format is that? JSON. The following is the JSON equivalent of the static inventory we used earlier

    {
        "webprod": {
            "hosts": [
                "web1",
                "web2"
            ]
        },
        "webdev": {
            "hosts": [
                "dev1",
                "dev2"
            ],
            "vars": {
                "user": "admin",
                "pass": "password"
            }
        },
        "_meta": {
            "hostvars": {
                "web1": {
                    "http_port": "123"
                },
                "web2": {
                    "http_port": "456"
                }
            }
        }
    }

    Notice how there is a top level key for each group. Each of these “group” keys can have the following keys:

    • hosts. This key contains a list of targets
    • vars. This is a dictionary that contains the variables for the group. The “webprod” didn’t have any group variables, so the “vars” key can be omitted
    • children. This key contains a list of children groups of this group. If it is not present Ansible will assume the group doesn’t have any children groups

    Also notice how there is another top level key called “_meta” which includes the host variables under a key called “hostvars”.

    Ansible expects the “dynamic inventory” script to implement 2 flags. Only one of these will be invoked at once:

    • “–list”. When the script is run with this flag it has to return the entire JSON structure as shown above
    • “–host”. This flag is followed by the name of a specific host in the inventory and when used your script has to return the variables for that host.

    IMPORTANT: In the past the “–host” flag was the only way of getting host variables but it is very inefficient to do things when Ansible needs to get the “hostvars” from many hosts, one at a time. So in modern versions of Ansible, the preferred way of implementing this functionality with the “–list” flag is by using the “_meta” key shown above. Also, to ensure Ansible pays attention only to the “_meta” section, the “–host” flag needs to be functional but needs to return only an empty dictionary.

    NOTE: If your preference is to use the “–host” flag instead your “_meta” still needs to include an empty “hostvars” dictionary as described in the documentation.

    Using the ansible-inventory tool

    Ansible provides a very handy tool to display and troubleshoot the inventory. The tool is called “ansible-inventory”. We can use this tool to observe how Ansible sees the inventory. You can see the full help page of the command by typing “ansible-inventory -h” but let’s play with some of the options here. Firstly we have “–list” that shows the full inventory as Ansible sees it.

    
    [root@alb-ansible3]# ansible-inventory -i staticinv.ini --list
    {
        "_meta": {
            "hostvars": {
                "dev1": {
                    "pass": "password",
                    "user": "admin"
                },
                "dev2": {
                    "pass": "password",
                    "user": "admin"
                },
                "web1": {
                    "http_port": 123
                },
                "web2": {
                    "http_port": 456
                }
            }
        },
        "all": {
            "children": [
                "ungrouped",
                "webdev",
                "webprod"
            ]
        },
        "webdev": {
            "hosts": [
                "dev1",
                "dev2"
            ]
        },
        "webprod": {
            "hosts": [
                "web1",
                "web2"
            ]
        }
    }
    

    There are a few things to note from the output above:

    • You need to specify the inventory file with the “-i” option. It doesn’t matter whether it is a script or a static file, you need to use the “-i” option. In this case I am using the INI inventory file we showed first. I have called it “staticinv.ini”
    • Notice how Ansible has taken the group variables of the “webdev” group and has turned them into host variables under the “_meta” section. So for us it is more efficient to use group variables but internally Ansible unfolds those into individual hosts variables. Consequently, the group keys show only the list of hosts in the group
    • Ansible has created the “all” group and has add the other groups as “children” of “all”. It has also added the “ungrouped” group. Now we understand how Ansible handles your plays when you specify “hosts: all”

    So the “–list” option helps us understand many things. But it would be good if it could provide the optimal JSON version of a static INI inventory file that we can use as a template to write the code of our dynamic inventory script. Luckily for us, that option is also available. It is just a matter of adding the “–export” flag to the previous command. Please note how this is in addition to “–list” not as a replacement.

    [root@alb-ansible3]# ansible-inventory -i staticinv.ini --list --export
    {
        "_meta": {
            "hostvars": {
                "web1": {
                    "http_port": 123
                },
                "web2": {
                    "http_port": 456
                }
            }
        },
        "all": {
            "children": [
                "ungrouped",
                "webdev",
                "webprod"
            ]
        },
        "webdev": {
            "hosts": [
                "dev1",
                "dev2"
            ],
            "vars": {
                "pass": "password",
                "user": "admin"
            }
        },
        "webprod": {
            "hosts": [
                "web1",
                "web2"
            ]
        }
    }
    

    Now the variables “user” and “pass” have been turned into group variables of the “webdev”. So that’s it, if we want to create a dynamic inventory script we can start by creating a sample INI version of the inventory and use the “–export” flag to create a JSON equivalent. We then write our code to produce that on demand

    Another handy option available in the “ansible-inventory” tool is “–graph”. When invoked it provides a graph representation of the inventory. Group names are prepended with “@”. Hosts in the group are shown indented under the group name

    [root@alb-ansible3]# ansible-inventory -i staticinv.ini --graph
    @all:
      |--@ungrouped:
      |--@webdev:
      |  |--dev1
      |  |--dev2
      |--@webprod:
      |  |--web1
      |  |--web2
    

    Built-in inventory plugins

    Ansible comes with some built-in inventory plugins to help you with some of the most common use cases. You can see what inventory plugins were installed by using the “ansible-doc” command as follows. My version of Ansible is 2.9.21 and this is what it came by default

    [root@alb-ansible3]# ansible-doc -t inventory -l
    advanced_host_list  Parses a 'host list' with ranges
    auto                Loads and executes an inventory plugin specified in a YAML config
    aws_ec2             EC2 inventory source
    aws_rds             rds instance source
    azure_rm            Azure Resource Manager inventory plugin
    cloudscale          cloudscale.ch inventory source
    constructed         Uses Jinja2 to construct vars and groups based on existing inventory
    docker_machine      Docker Machine inventory source
    docker_swarm        Ansible dynamic inventory plugin for Docker swarm nodes
    foreman             foreman inventory source
    gcp_compute         Google Cloud Compute Engine inventory source
    generator           Uses Jinja2 to construct hosts and groups from patterns
    gitlab_runners      Ansible dynamic inventory plugin for GitLab runners
    hcloud              Ansible dynamic inventory plugin for the Hetzner Cloud
    host_list           Parses a 'host list' string
    ini                 Uses an Ansible INI file as inventory source
    k8s                 Kubernetes (K8s) inventory source
    kubevirt            KubeVirt inventory source
    linode              Ansible dynamic inventory plugin for Linode
    netbox              NetBox inventory source
    nmap                Uses nmap to find hosts to target
    online              Online inventory source
    openshift           OpenShift inventory source
    openstack           OpenStack inventory source
    scaleway            Scaleway inventory source
    script              Executes an inventory script that returns JSON
    toml                Uses a specific TOML file as an inventory source
    tower               Ansible dynamic inventory plugin for Ansible Tower
    virtualbox          virtualbox inventory source
    vmware_vm_inventory VMware Guest inventory source
    vultr               Vultr inventory source
    yaml                Uses a specific YAML file as an inventory source
    

    Create your first dynamic inventory

    So far we know that a dynamic inventory script needs to return a well-known JSON structure. So how do you obtain the information to populate the JSON? It depends on your use case. Ultimately, you will have a source of truth for your inventory information and you will have to interact with that source programmatically. For example, if the inventory information is on a database you will have to write a script that queries the database to find out what to put in the JSON output. Other examples could be Excel or even a text file. Nowadays it is very common to deal with systems that expose a REST API interface and all programming languages have web client libraries that allow you to talk to such API’s. In the next post we will show you an example of how to create a dynamic inventory for your Dell infrastructure by using CloudIQ’s REST API

    To wrap up this post let’s show how to create the most basic dynamic inventory script how to use it . For simplicity we are going to drop the “webdev” group and create a script that returns the details of the “webprod” group only, including the “_meta” with their host variables. In my system I have created a python script called “basicinv.py” that looks as follows:

    [root@alb-ansible3]# cat basicinv.py
    #!/usr/bin/env python3
    import json
    output = {
        "_meta": {
            "hostvars": {
                "web1": {
                    "http_port": 123
                },
                "web2": {
                    "http_port": 456
                }
            }
        },
        "webprod": {
            "hosts": [
                "web1",
                "web2"
            ]
        }
    }
    print(json.dumps(output))
    

    It is creating a dictionary with the static information and using the “json.dumps” function to dump it on the terminal. Notice how for simplicity I am not checking for “–list” or “–host” flag. So the script dumps everything every time which is the default behavior of “–list”. Hence running tasks for “all” hosts will fine but not for specific hosts. The objective was to create the script as simple as possible so we will leave the “–host” flag out in this post. In the next post of this series we will use the “argparse” library to implement both flags properly.

    [root@alb-ansible3]# ansible all -i basic.py -m debug -a "var=http_port"
    web2 | SUCCESS => {
        "http_port": 456
    }
    web1 | SUCCESS => {
        "http_port": 123
    }
    [root@alb-ansible3]# ansible web1 -i basic.py -m debug -a "var=http_port"
    [WARNING]: Unable to parse /root/basic.py as an inventory source
    [WARNING]: No inventory was parsed, only implicit localhost is available
    [WARNING]: provided hosts list is empty, only localhost is available. Note that the implicit localhost does not match 'all'

    The previous screenshot shows the ad-hoc “debug” running successfully against “all” hosts but not against host “web1” as expected as this would require a functional “–host” flag as explained earlier. Notice how we use the “-i” option to specify the script.

    Now let’s see if it works with a playbook too. I have created the following “ping.yml” playbook

    - name: Check that our targets are reachable
      hosts: webprod
      gather_facts: false
    
      tasks:
      - ping:

    Now we run it like this. Notice above how we are targeting the “webprod” group. Using “all” works as well. If we try with an individual host like “web1” it also works, but this is only because our simple “ping.yml” doesn’t require Ansible to look for the “hostvars”. In that case we would need to make our simple dynamic inventory script award of the “–host” flag and return an empty dictionary as we discussed earlier

    [root@alb-ansible3]# ansible-playbook -i basicinv.py ping.yml
    
    PLAY [Check that our targets are reachable] *********************************************************************
    
    TASK [ping] *******************************************************************************
    ok: [web2]
    ok: [web1]
    
    PLAY RECAP *******************************************************************************
    web1 : ok=1    changed=0    unreachable=0    failed=0    skipped=0    rescued=0
    web2 : ok=1    changed=0    unreachable=0    failed=0    skipped=0    rescued=0 
    

    Things to watch out for – Possible errors

    There are 2 important things to watch out for when you create your own script:

    • Make sure your script has execute permission, otherwise you will get the error “Unable to parse /root/basic.py as an inventory source”
    • Make sure you add the shebang that matches your Pyhon version, which in my case is “!/usr/bin/env python3“. Otherwise you get the error “Failed to parse with script plugin” below. Notice how it tries to parse it as a script first and then it tries to parse it as an INI before it gives up
    [root@alb-ansible3]# ansible-playbook -i basic.py ping.yml
    [WARNING]:  * Failed to parse /root/basic.py with script plugin: problem running
    /root/basic.py --list ([Errno 8] Exec format error: '/root/basic.py')
    [WARNING]:  * Failed to parse /root/basic.py with ini plugin:
    /root/basic.py:1: Expected key=value host variable assignment, got: json
    [WARNING]: Unable to parse /root/basic.py as an inventory source
    [WARNING]: No inventory was parsed, only implicit localhost is available
    [WARNING]: provided hosts list is empty, only localhost is available. Note that the implicit localhost does not
    match 'all'
    

    I hope you found this introduction valuable. On the second part we will create the full-blown solution for a dynamic inventory script where we extract the data from a REST API at runtime. See you soon!

  • Grafana variables – Easy step-by-step tutorial

    This is a very important and powerful feature in Grafana. Unfortunately, when one searches in Google the top hits tend to be Grafana official documentation, which more often than not is very formal. There are many people out there that learn by seeing examples. That’s the purpose of the tutorial, to show a clear step-by-step tutorial that is easy to understand and follow. I am running Grafana v7.5.15. I am going to include a good amount of screenshots to make it as easy to follow as possible. No doubt the interface will change in the future (that’s the nature of software) but hopefully it won’t have changed much by the time you read it.

    Variables allow you to update your dashboard dynamically by selecting interactively what you want to see. For example, I have a dashboard here that provides information about storage arrays in a datacenter, such as capacity and performance metrics. The datacenter in question has multiple storage arrays of different types. By default the panels in the dashboard show information about “all” of the arrays. But often, I would like to focus only on arrays of a certain type. The way of enabling this is to have a drop-down menu that allows me select the array type. When I select one type all the other arrays are hidden. As we will see the behavior is configurable and allows us to enable multiple selections.

    Grafana shows a separate drop-down for each variable you configure in your dashboard. You can have multiple drop-down menus. When you make a selection in any of them, the changes are applied to all panels in the dashboard.

    The way you obtain the labels for the drop-down menu varies. In our example we will use the “Query” type which means we perform a query to the data source to extract them. The actual syntax depends on the data source. Why? Grafana uses the query language native to the data source and as you know Grafana can work with a wide range of data sources: InfluxDB, Prometheus, MySQL … . In this post I am going to focus on Prometheus which seems to be one of the most prevalent out there nowadays.

    Everything starts by creating the variable. For this you need to open the “Dashboard settings” by click the “gear” symbol.

    Once in “Dashboard settings” click on “Variables”. Let’s click “New” to create our first variable.

    The “General” section has some very important fields. We are going to use “Query” type but you get other interesting possibilities. Two other important fields:

    • Name: This field needs to match what you use in the “query” field in the panel configuration
    • Label: This is what gets displayed in the drop-down menu for users to select

    Since we selected “Query” in the “General” section, we get a “Query Options” section. Here we need to select our data source and the query that will extract the labels that will be shown in the drop-down menu. As we mentioned, the query is written in a specific way to the data source type. For example, for a MySQL query type we would need to write an actual SQL query, but for Prometheus we use “PromQL”, ie Prometheus Query Language. In the screenshot above you can see I am using “label_values(name)”. This query will retrieve all the labels that were defined for the metric. So it is very important that what you put here matches exactly the labels you used. For example, the following is the code in my exporter:

    STORAGE_FREE_PERCENT = Gauge('storage_free_percent','Percentage of free storage',['name','system_type'])

    Notice how ‘name’ is one of the two labels defined for the metric. There could be multiple ones, hence they are a “list” enclosed by square brackets.

    I you enable “sort”, the labels in the drop-down menu will be sorted alphabetically. Selecting “multi-value” will allow you to select multiple labels at the same time. The “Include All option” will also show an “All” label that selects all labels. If all goes well, at the bottom of the “Edit” page you can see a “preview of values”. It helps you see if your query is working.

    Once you are finished configuring the variable, click “Update”. This brings you back to the “Variables” top level menu. You will see a green mark if the variable is correctly being referenced by your dashboard or by other variables. In the screenshot below you can see I have created a variable “system_type” and another one for “name”

    Before we move on to the final step let’s see graphically how the settings.

    As you can see the final step is to build a query in your panel that includes the name of the metric and the reference to your variables in between curly brackets. The variable itself needs to be prepended with the “$” symbol.

  • Multi-cloud agility with governance in ServiceNow

    I have been talking a lot lately about using ServiceNow as a tool to deliver unified end-user experience and governance for multi-cloud architectures. Most organizations today have multiple clouds public and private. This hopefully helps provide the best suitable landing zone for every workload.

    However, the mainstream approach to consuming public cloud is to give developers a credit card and say “here you go”, which is not a good governance best practice. So it doesn’t come as a surprise when an outrageous bills come at the end of the month. The other big issue with this approach is that every cloud becomes a silo. On the positive side, developers get more productive and deliver value to the business faster.

    In videos like this one you can see how it is possible to deliver a unified multi-cloud experience across multiple public and private clouds. The example uses ServiceNow but it will work for other tools like it. The principle is to offer the same type of item with comparable T-shirt sizes from a single catalog in ServiceNow. You will notice in the video how the user can see what the same VM costs on each cloud. When you pair this with chargeback, it helps developers to make the right decision as to where to run a workload. You can also throw into the mix approvals based on the characteristics of the item (ex: is the storage capacity larger than a certain amount? does the VM require too much RAM or a GPU? does the VM cost more than $100 a month?) as well as CMDB integration for resources in all clouds, etc.

    The governance benefits are enormous but developers are not equally impressed. They like to use tools like Terraform or Ansible to provision their environments at the speed of light (almost) and they will argue that going to a GUI like a ServiceNow catalog makes them slower. And of course, when developers use “Infrastructure as Code” directly on the public cloud they bypass all the governance.

    By now, probably you can guess where I am heading: is there a way of reconciling both views of the world? Ultimately the key to delivering agility via automation is having an API … and ServiceNow has a great REST API. In particular, you can order items from a service catalog using the REST API, which means that developers can order catalog items using a tool like Terraform or Ansible but still be subjected to the guardrails that the governance policies have put in place

    With this approach:

    • the organization creates a unified governance and end-user experience for all public and private cloud resources
    • developers can use Infrastructure as Code tools and processes that make them agile
    • the same REST API provides programmatic access to resources in all clouds
    • approvals and other control processes remain in place and it is easier to keep costs under control

    If you are interested in the details of how to do this, you can visit my previous post about how to create requests from a ServiceNow catalog using Ansible and Postman (what about Terraform?)

    Let’s see an example of how it works in practice. This is our infrastructure catalog. It allows the user to consume infrastructure from private and public cloud. We are going to use a STaaS (Storage-as-a-Service) as an example because the approvals are very intuitive. This catalog item allows you to provision file storage to an existing virtual machine. This item includes a capacity-based approval. The idea is that any request for more than a certain threshold is going to require an approval. You could have additional thresholds that require 2 or potentially VP approval. You can see how this constraint is going to encourage reasonable consumption by the end users. No one likes to wait for anything these days. In this demo environment the threshold is set very low, to just 50GB.

    The objective is to use code to order storage for a VM and demonstrate that:

    • if the capacity requested is lower than the threshold the request goes straight through
    • if the capacity requested is above the threshold the approval process kicks in

    We are going to use Postman to do this demonstration. You can find the Postman collection I am using in this GitHub repo. The process has essentially 2 steps: add an item to the cart and finally submit the cart. Here you can see we have sent a REST API call to add the File STaaS to the cart

    URL needs the sys_id of the catalog (get it from URL) or programmatically (with this API call). The payload needs to include quantity and all the variables required. You can find out the variables required using this API call. The status code will be 200. At this stage you can see there is 1 item in the cart

    The second step then is to submit the cart. We can do so with this REST API call. Note how it is also a POST call but it doesn’t require a Body parameter. It feels intuitive that you might have to at least specify the cart ID, but this is not necessary because a user only has one cart.

    You can see request “REQ0011028” was created. If I navigate to “Requests” for the user we can see the status of the request. The approval process is triggered because we requested 60GB which is more than the threshold. This is good because we can use Infrastructure-as-Code tools to provision infrastructure while maintaining governance.

    A key ingredient to make this both agile and useful for the business is to be wise with the thresholds. Your organization should consider what threshold provides the 80/20 or even perhaps the 90/10 rule so that the majority of provisioning activity can happen without delays.

    To finish off let’s repeat the request but this time the capacity required will be 40GB which is under the threshold.

    This time, when we go to “Requests” we can see that the request is already complete. It didn’t need an approval.

    If I log in to the Virtual Machine straight away I can see that the storage has been created, mounted and configured. As you can see I can even create a file on it.

    Conclusion

    Many organizations are implementing private clouds to that deliver a self-service experience to end-users by implementing automation and exposing it to users via an ITSM tool like ServiceNow. This architecture can be extended to consume also public cloud resources in such a way that a consistent end-user experience is delivered regardless of where the resources are created. This also brings an opportunity to break down silos and create a unified governance framework for all clouds along with integrated CMDB and incident management. This is very important especially now that cost control has become paramount. On the other hand developers demand accessing resources via API so that they can iterate faster and deliver more value to the business. In this blog post we have demonstrated how developers can leverage the ServiceNow REST API to automate the provisioning of resources in any cloud at the speed they need without jeopardizing governance.

  • ServiceNow catalog request with Postman

    In this blog post we will explore how to order items from a ServiceNow catalog using the ServiceNow REST API. There are a few examples out there that use “REST API Explorer” inside ServiceNow. I will focus here on how to do it from an external tool. In particular I am going to provide instructions for Postman. This post is the stepping stone for this follow up post where I try to solve an interesting use case of providing multi-cloud with governance through ServiceNow. You can get the Postman collection I am using from this GitHub repo.

    This is the latest addition to a series of popular ServiceNow related posts:

    There is also a follow up post that uses what I am covering here to allow developers to provision multi-cloud IT resources while observing any governance that might have been implemented in ServiceNow.

    In the post about creating Incidents we covered the “REST API Explorer” tool in more detail. Please refer to that one if you are new to it. In this post we will use the “Service Catalog API“. In this screenshot you can see it is a very extensive API. It provides 47 API calls as of time of this writing.

    Postman

    Now let’s move to Postman. Feel free to use any other REST API developer tool you are used to. If you want to follow along you can retrieve my Postman collection from this GitHub repo. The Postman collection provides 3 folders. In this post we will use the “Catalog Request” folder. The other 2 folders contain the API calls that were used in 2 previous posts in this series mentioned above.

    Requesting items from catalogs can be done in two ways that mimic the behavior of the user in the GUI:

    • order now
    • add to cart and submit the cart

    Add to Cart and Submit order

    This is a 2-step process but it might be more convenient if you are planning to order multiple items in the same request.

    • add an item to the cart
    • submit the cart

    Adding an item to the cart is done with the following API call. Please replace {instance} with your particular ServiceNow instance.

    There are 3 things you need to include:

    • sys_id“. This is the “sys_id” of the item itself. As you can see it needs to be included in the URL
    • sysparm_quantity“. This is the quantity of this item you want to add to the cart. It is included in the “Body” parameter and it is required
    • variables“. This is also in the “Body” and needs to include all the information that you would normally provide through the GUI when creating the request. In my case this catalog entry allows me to request the installation of an application on a virtual machine. At a minimum you will need to include all variables that are defined as “mandatory” in your catalog. In my example below I am going to request the installation of an application on an existing virtual machine. You can see I am requesting the installation of Apache web server on a VM called “albtest3_01” which lives in my “sin” datacenter

    If all goes well, you should get a status code of 200 and the details of the cart will be provided in the response.

    You can find out the “sys_id” of the catalog item by browsing to the item itself in your catalog. It will be included in the URL itself as seen here

    Alternatively you can use other calls in the “Service Catalog API” to get it programmatically. One example could be executing this call and looking for the “name” of the item you want:

    You can also find out programmatically what variables you need to include with the following API call. It returns information about every parameter the specific item defined by “sys_id”. Use the “name” fields as the keys in your “Body” parameter. Also pay attention to whether variables show as “mandatory: true“.

    Notice how the response is providing even the valid “choices” for a variable that has been configured as a “select box”.

    At this point you have an item in the cart. You could potentially add other items to the cart but if you need things to be ordered in a certain sequence order 1 item at a time and orchestrate them all in your Infrastructure as Code tool of choice. The final step is to “submit the order”. This is done with the following API call

    This API call is also part of the Postman collection you downloaded. As you can see in the screenshot below, even though this is a POST call, it doesn’t require a “Body” payload. If successful you should get a status code of 200 and the “Body” of the response will contain the “requests number”.

    Order now

    This is the most straight forward process as it consists of a single REST API call. It uses the “Buy Item (POST)” call. This is the call as shown in REST API Explorer.

    This call needs the same payload that we used to add an item to the cart, ie the quantity and the specific variables that are typically provided in the form in the GUI.

    As you can see, this API call returned a request number instead of cart details because the request was created in a single step. In the following screenshot we can see the request in the “Requests” application in the GUI.

    And in the details of the “Request Item” we can see that the information we specified in the body of the API call was used to create the request.

    Next steps

    Postman allows you to generate code in your language of choice, ex: Python, Golang, etc. You can use this to include what we have covered into a larger script that runs additional tasks.
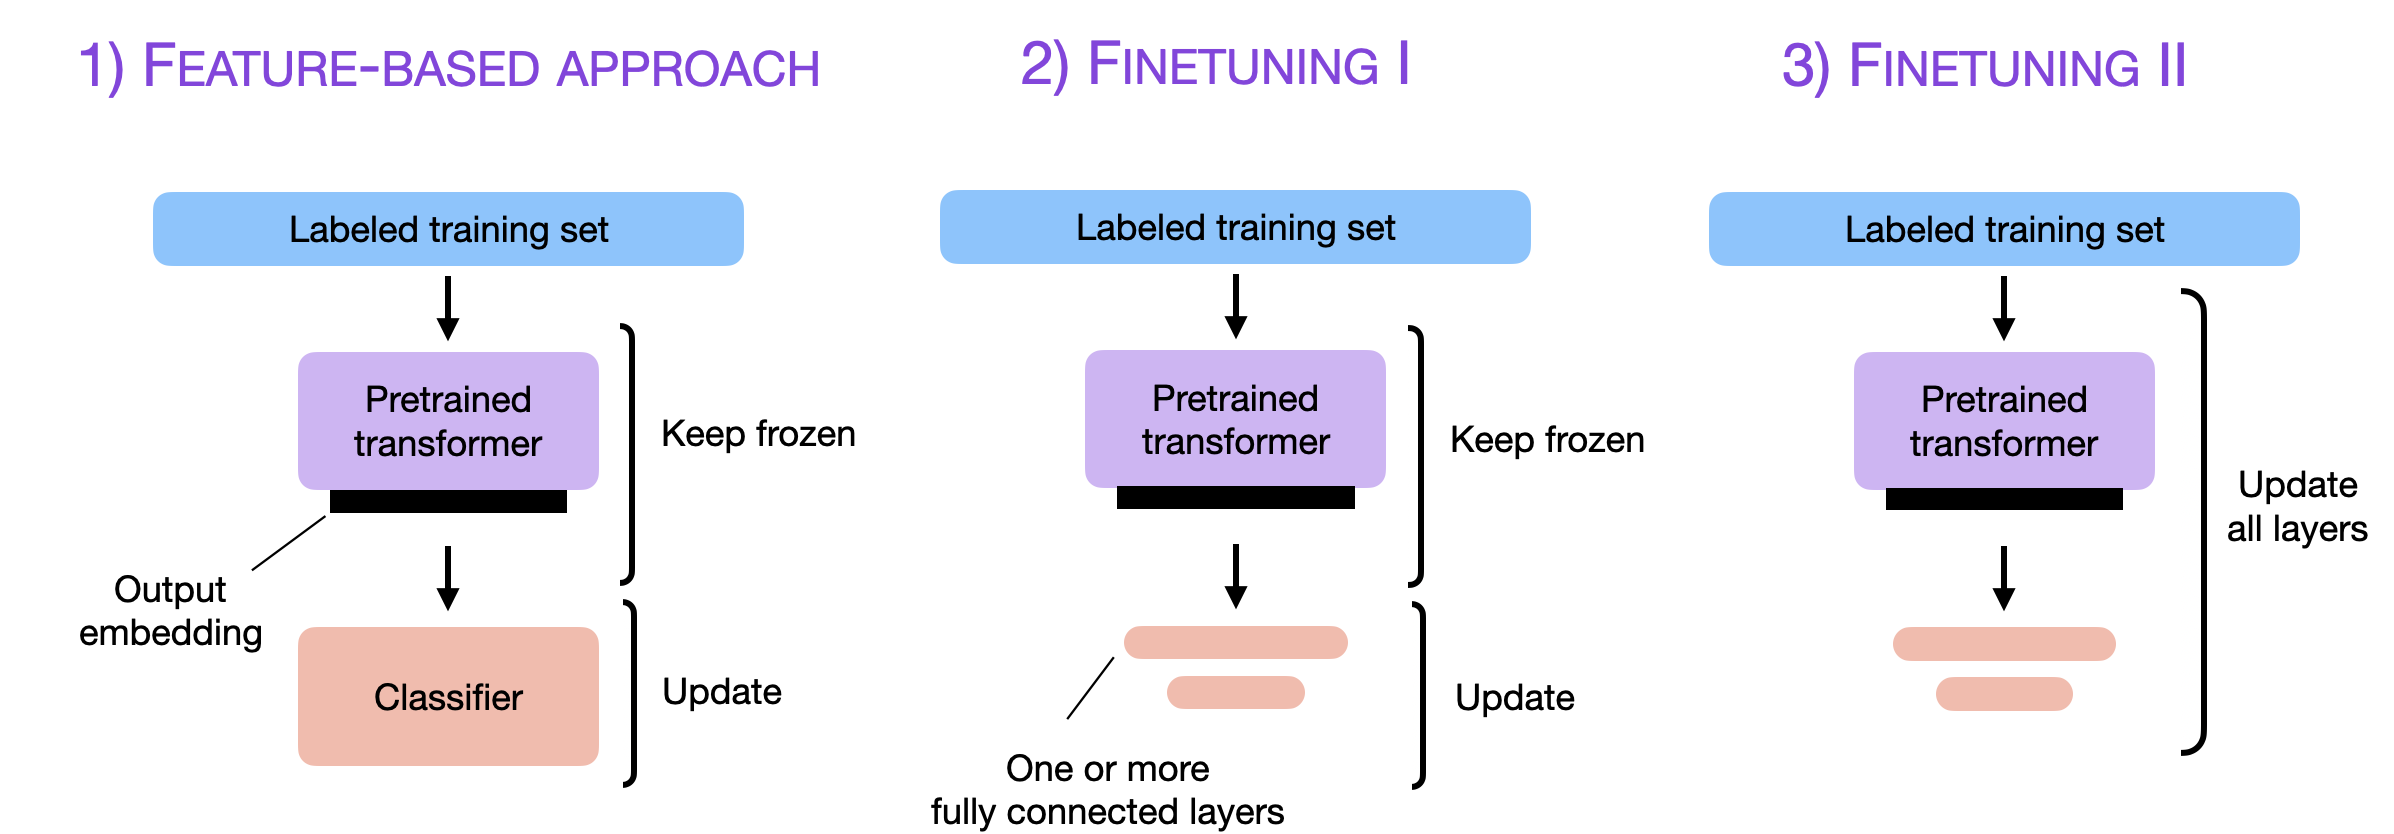
    Alternatively, you might want to use configuration management or provisioning tools like Ansible or Terraform to order items from the ServiceNow catalog.