This is a very important and powerful feature in Grafana. Unfortunately, when one searches in Google the top hits tend to be Grafana official documentation, which more often than not is very formal. There are many people out there that learn by seeing examples. That’s the purpose of the tutorial, to show a clear step-by-step tutorial that is easy to understand and follow. I am running Grafana v7.5.15. I am going to include a good amount of screenshots to make it as easy to follow as possible. No doubt the interface will change in the future (that’s the nature of software) but hopefully it won’t have changed much by the time you read it.
Variables allow you to update your dashboard dynamically by selecting interactively what you want to see. For example, I have a dashboard here that provides information about storage arrays in a datacenter, such as capacity and performance metrics. The datacenter in question has multiple storage arrays of different types. By default the panels in the dashboard show information about “all” of the arrays. But often, I would like to focus only on arrays of a certain type. The way of enabling this is to have a drop-down menu that allows me select the array type. When I select one type all the other arrays are hidden. As we will see the behavior is configurable and allows us to enable multiple selections.

Grafana shows a separate drop-down for each variable you configure in your dashboard. You can have multiple drop-down menus. When you make a selection in any of them, the changes are applied to all panels in the dashboard.
The way you obtain the labels for the drop-down menu varies. In our example we will use the “Query” type which means we perform a query to the data source to extract them. The actual syntax depends on the data source. Why? Grafana uses the query language native to the data source and as you know Grafana can work with a wide range of data sources: InfluxDB, Prometheus, MySQL … . In this post I am going to focus on Prometheus which seems to be one of the most prevalent out there nowadays.
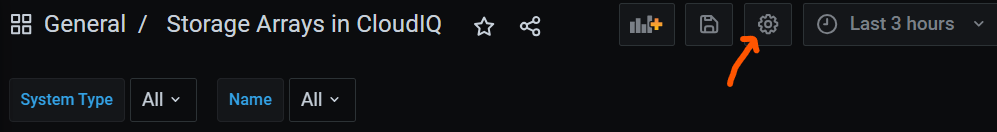
Everything starts by creating the variable. For this you need to open the “Dashboard settings” by click the “gear” symbol.
Once in “Dashboard settings” click on “Variables”. Let’s click “New” to create our first variable.

The “General” section has some very important fields. We are going to use “Query” type but you get other interesting possibilities. Two other important fields:
- Name: This field needs to match what you use in the “query” field in the panel configuration
- Label: This is what gets displayed in the drop-down menu for users to select

Since we selected “Query” in the “General” section, we get a “Query Options” section. Here we need to select our data source and the query that will extract the labels that will be shown in the drop-down menu. As we mentioned, the query is written in a specific way to the data source type. For example, for a MySQL query type we would need to write an actual SQL query, but for Prometheus we use “PromQL”, ie Prometheus Query Language. In the screenshot above you can see I am using “label_values(name)”. This query will retrieve all the labels that were defined for the metric. So it is very important that what you put here matches exactly the labels you used. For example, the following is the code in my exporter:
STORAGE_FREE_PERCENT = Gauge('storage_free_percent','Percentage of free storage',['name','system_type'])Notice how ‘name’ is one of the two labels defined for the metric. There could be multiple ones, hence they are a “list” enclosed by square brackets.
I you enable “sort”, the labels in the drop-down menu will be sorted alphabetically. Selecting “multi-value” will allow you to select multiple labels at the same time. The “Include All option” will also show an “All” label that selects all labels. If all goes well, at the bottom of the “Edit” page you can see a “preview of values”. It helps you see if your query is working.

Once you are finished configuring the variable, click “Update”. This brings you back to the “Variables” top level menu. You will see a green mark if the variable is correctly being referenced by your dashboard or by other variables. In the screenshot below you can see I have created a variable “system_type” and another one for “name”

Before we move on to the final step let’s see graphically how the settings.

As you can see the final step is to build a query in your panel that includes the name of the metric and the reference to your variables in between curly brackets. The variable itself needs to be prepended with the “$” symbol.
Categories: Uncategorized


1 reply »