However, while showing the demos and having conversations with customers, I can see a question coming up more often. How do we cope with errors? It makes sense that this question is coming up now. We are taking the automation conversation out of the realm of the datacenter and elevating it all the way to the end-user in the ITSM world. This means “Enterprise” requirements, which in turn means less room for failure. Also, if we expose it to the end-user we are no longer talking about dozens of engineers, now we have potentially thousands of possible consumers.
A sample architecture like shown in the videos is as follows:
The requirements are:
let the user know that the workflow didn’t complete so that they are not sitting there waiting. Depending on the error they might want to retry
inform the engineers that a specific workflow is failing and they need to look into it
This can and should be done both at the ServiceNow level and the Ansible level. In this post we are going to focus on the Ansible side of things. Most mature organizations use RedHat Ansible Automation Platform. I have also included the old name Ansible Tower because somehow is still stuck in people’s heads … it is certainly shorter and easier to pronounce. Of course this is also applicable to AWX, the community support edition
From an Ansible syntax perspective you can do error handling with things like “blocks and rescue” or other techniques. However, our guiding principle here is not so much to make sure the playbook continues despite errors and ends gracefully. What we want in this case is to make sure that both the engineer and/or user gets notified. For this purpose I find the “Notifications” functionality does the job nicely. You can find “Notifications” on the left bar under the Administration menu. If you click the “Add” button you get a menu like this
After providing a name you need to select the notification “Type”. Depending on your selection a number of relevant configuration options are shown. For example if email is selected it will ask for IP and port of the SMTP server and so on. Once you fill those details scroll to the very bottom and slide the “Customize messages” button. This will reveal the syntax of the notification messages. The tool supports sending notification on 7 different types of events including start, error, time out and even the outcome of an approval. Notice how the prepopulated messages use variables with the double curly bracket syntax.
In my example I have created a notification to send emails to a Zimbra SMTP server we have in the lab. As you saw in the previous image is called “Zimbra email”. For testing purposes I have created a job template that runs a playbook called “wrong.yml”. This is single task playbook that uses the “uri” module to access a webpage. I have fed the task with an IP address that doesn’t exist, so the playbook will fail
From the template we click in the “Notifications” tab. It will show you all the notifications you have configured. In my example “Zimbra email” is the only one. On the right side you will have the opportunity to enable any of the available notifications when the template starts, succeeds or fails. If you do the same thing for a “workflow template” it will show an additional slide button named “Approval”
All is left to do is to run the template. When I run it fails as expected and I get an email in my Inbox with the following message. Notice how the body of the email maps to the syntax we saw in the “Customize messages” menu
These messages could be sent to a group of engineers that look after the platform. I particularly like the fact that there is a “Webhook” type. This opens the possibility of sending a notification to a Teams channel which is a more popular choice than email these days. You can see in this previous post how to send notifications to a Teams channel. Additionally it would make sense to create an incident automatically in your ITSM tool. Some time ago we also published a tutorial to show you how to create incidents in ServiceNow programmatically.
This will be a quick one. I was recently experimenting with creating an S3 bucket GCP using Ansible and I came across this error:
{
  "msg": "GCP returned error: {'error': {'code': 403, 'message': \ansible@vexpose.iam.gserviceaccount.com does not have storage.buckets.get access to the Google Cloud Storage bucket. Permission 'storage.buckets.get' denied on resource (or it may not exist).\, 'errors': [{'message': \ansible@vexpose.iam.gserviceaccount.com does not have storage.buckets.get access to the Google Cloud Storage bucket. Permission 'storage.buckets.get' denied on resource (or it may not exist).\, 'domain': 'global', 'reason': 'forbidden'}]}}",
  "invocation": {
    "module_args": {
      "name": "gcp_s3",
      "project": "vexpose",
      "auth_kind": "serviceaccount",
      "storage_class": "COLDLINE",
... <<< output truncated >>>
After seeing “Permission Denied” I naturally started to look at the roles that were assigned to the account . I discovered later that the “Storage Admin” role provided already that permission, but in the process I wasted some precious time adding other roles that provided that permission yet again. So I felt compelled to write this quick post to help other people save their time.
If this is happening to you the resolution could be quite simple. We must remember that GCP (like other public cloud providers) uses a single namespace for all customers. Therefore the bucket name must be “universally” unique. If it isn’t it takes it as you are trying to make changes to an existing bucket that another customer owns and it throws the misleading “permission denied” error. So, simply choose a more complex name and see if that fixes the error.
You can quickly test if it is an issue with your name not being unique by trying to create a bucket using GCP web interface for example. It if is already taken you will receive a message like this.
In the world of software development, Murphy’s law holds an unassailable truth: Anything that can go wrong, will go wrong. As a proud member of this masochistic club, you might be looking for innovative ways to stall your Kubernetes enterprise rollout. Maybe you want to add a little chaos to your routine CI/CD workflow, or perhaps you’re just a thrill-seeker who loves the high stakes game of orchestration roulette. Either way, you’ve come to the right place. Sit back, relax, and let us guide you through the delightful maze of missteps and detours that will ensure your Kubernetes enterprise rollout is anything but a walk in the park.
Ah, Kubernetes! The open-source platform that’s become the equivalent of a Hollywood blockbuster in the tech world. It’s like the Iron Man of container orchestration, bringing together an array of superpowers including automation, scaling, and management of container deployment. Enterprises are lining up to get their tickets, excited by the promises of streamlined application deployment. But before you go head over heels for Kubernetes, remember, even Iron Man had his quirks. Navigating the CI/CD waterfall can sometimes feel more like a rollercoaster ride without a seatbelt. So before you charge headfirst into your enterprise rollout, take a moment to consider Murphy’s Law – anything that can go wrong, will go wrong. So buckle up, my friends, it’s going to be a wild ride.
Indeed, Kubernetes is a boon for developers, cloud-native architects, and business owners alike. Its versatility and flexibility can make you feel like a superhero orchestrating seamless deployments. But when it comes to deploying and scaling in Enterprise data centers, Kubernetes might just swap its Iron Man suit for a Godzilla costume, spawning fresh challenges born out of its cloud-native architecture. This transition can lead to excessive mental gymnastics as you grapple with these new beasts of burden. So, if you’re feeling like a deer caught in the headlights, staring down the Kubernetes-python poised to gobble up your Enterprise applications, fear not! This blog is your sanctuary, your guide, your ‘how-to-tame-your-dragon’ manual. Stay with us, as we venture into the labyrinth of Kubernetes deployment and come out the other side grinning. 🙂
Let’s dive into the 10 ways you might unintentionally stall your enterprise Kubernetes rollout, and inadvertently send your organization spiraling back to the ‘golden age’ of monolithic architecture:
1.Do Not Plan Your Deployment: Some may argue that the beauty of Kubernetes lies in its simplicity, and indeed, the internet is abundant with blogs and videos promoting the notion that the deployment process is a walk in the park. Following such advice without investing time in understanding your unique use case could be a significant pitfall. Kubernetes deployments require thoughtful planning, taking into account the intricacies of workload requirements, resource allocation, and network architecture. The idea of “Kubernetes is the easy button for everything” is a perilous assumption that can easily derail your enterprise rollout. Always remember, while Kubernetes does a spectacular job in many aspects, it’s not a one-size-fits-all solution for every enterprise problem.
2. Avoid Using Certified Kubernetes Distributions: Now this one’s a head-scratcher, isn’t it? Here’s the thing, though: Kubernetes is powerful, flexible, and can be customized to a dizzying degree. However, this does not mean you should do everything from scratch. Consider this – why would you build your car when you can buy a perfectly good one off the lot? Certified Kubernetes distributions, like Red Hat OpenShift or VMware Tanzu, come with the assurance of being properly configured, tested, and meeting industry standards. They’re like your ready-to-drive cars, offering robust features and world-class support. By choosing to bypass these options, you’re essentially signing up for unnecessary headaches that could easily stall your enterprise rollout. Remember, Kubernetes is a tool, not an ideology. There’s no virtue in unnecessary complexities.
3. Do NOT Implement Security Best Practices: This one’s a classic misstep in the tech world. Yes, Kubernetes is inherently secure, but that doesn’t mean it’s invincible. If you’re looking to stall your enterprise rollout, then by all means, ignore security best practices. However, if you’re keen on a smoothly functioning system, pay close attention to security measures like access control, network segmentation, and encryption. It’s akin to leaving your car unlocked in a crowded parking lot — sure, it might have an immobilizer and alarm system, but why invite trouble? Access control ensures only authorized personnel can interact with your Kubernetes clusters, network segmentation limits the blast radius of potential breaches, and encryption keeps your sensitive data safe in transit and at rest. Failing to implement these measures is like leaving the keys in your car with the engine running – a surefire way to invite mischief. Remember, in the world of Kubernetes deployments, security is not an afterthought, it’s a primary driver of successful CI/CD pipelines and enterprise rollouts.
4. Forget about Using CI/CD Pipelines: There’s a certain masochistic charm in choosing not to use CI/CD pipelines in your enterprise rollout. After all, who needs automation when you can manually deploy your applications, right? CI/CD pipelines, or Continuous Integration/Continuous Deployment pipelines, are like that studious classmate who always double-checks their work before submitting it – they automate the deployment process and ensure that all changes are thoroughly examined and validated before entering the production environment. If you’re a fan of chaos and unpredictability (and potentially stalling your Kubernetes enterprise rollout), then by all means, go ahead and give CI/CD pipelines a pass. However, if you value efficiency, reliability, and sanity, incorporating CI/CD pipelines into your operations could be a game-changer. They ensure a streamlined, error-free process that keeps your applications updated and secure, allowing your team to focus on what truly matters – building and improving your products. But hey, if you’re in the market for a bit of pandemonium, feel free to ignore this advice!
5.Visibility/Observability, what’s that?: There’s something rather intriguing about stumbling in the dark, isn’t there? For those of you who enjoy a good surprise, why not apply this approach to your Kubernetes deployment? Think about it, with no comprehensive monitoring solution in place, every day is like a thrilling game of hide-and-seek with your application’s performance, capacity, and availability. However, if you (like most sane people) prefer to know what’s happening under the hood, it’s time to incorporate a robust monitoring solution into your Kubernetes enterprise rollout. Think of it as a reliable co-pilot that keeps an eye on the road while you’re busy steering the ship. It helps you identify potential roadblocks or speed bumps, ensuring your journey toward a successful enterprise rollout is as smooth as possible. So go ahead, embrace the unknown, or better yet, ensure your unknowns are known with a comprehensive monitoring solution. But remember, no pressure; after all, it’s only your Kubernetes deployment we’re talking about here!
6.Don’t care about Config Management Tools: If you’re fond of unpredictability and enjoy the thrill of variance, throwing caution to the wind when it comes to config management could be your next adrenaline spike! Who needs tools like Ansible or Puppet that automate the configuration of your Kubernetes deployment and ensure consistent settings across your environment? Why make life easier and your enterprise rollout smoother when you can indulge in the chaotic symphony of inconsistency? Sure, these tools can simplify the management of your Kubernetes configuration, reduce errors, and ensure uniformity across your deployment, but where’s the fun in that? So sit back, relax, and let the inconsistencies rollick through your deployment, because who wouldn’t love a good configuration surprise?
7.Forget about Disaster Recovery: If you’re the type who loves to live on the edge, why not take a leap of faith with your Kubernetes rollout too? After all, implementing disaster recovery measures like backup and recovery procedures is like carrying an umbrella all the time just because it might rain. Sure, these measures could prevent your enterprise from figuratively getting drenched in the event of an unexpected outage or data loss, but what’s a little water, right? Having a disaster recovery plan could mean the difference between a minor hiccup and a full-fledged organizational crisis during a catastrophe, but let’s face it, who doesn’t love a little game of Russian Roulette with their Kubernetes deployment? So, go ahead and roll the dice. After all, disaster recovery is just for those who aren’t fans of suspense, right?
8.Train Your Staff (or Don’t): Now, here’s a real knee-slapper: education. Nothing quite like seeing your team scramble around like a bunch of cats on a hot tin roof because they don’t know their Pods from their Nodes. Who needs well-trained staff, conversant with Kubernetes best practices, when you can bask in the glorious pandemonium of mismanaged deployments instead? Sure, giving your employees the necessary skills to effectively manage and operate your Kubernetes deployment might lead to fewer issues, greater efficiency, and a more successful enterprise rollout. But let’s be real, why stifle the potential theatre of the absurd that could result from untrained staff wrestling a mammoth like Kubernetes? Life is a stage, after all, and in your Kubernetes drama, training is just too mainstream a script. So, sit back, grab some popcorn, and enjoy the show!
9.Live in the Past: Here’s a revolutionary idea – rolling with the times. You could, if you’re feeling particularly adventurous, actually stay up-to-date with the latest Kubernetes releases and security patches. That, of course, would imply that you’re interested in ensuring your deployment operates with the latest features and security updates. But hey, who doesn’t love a little nostalgia? Sure, you could prioritize keeping your enterprise rollout in line with the newest, slickest versions of Kubernetes, ensuring that your CI/CD pipelines are as cutting-edge as they come, but isn’t there a certain charm in running your enterprise on an antiquated version that’s as outdated as a floppy disk in an AI lab? After all, cybersecurity threats, outdated functionalities, and inefficiencies are just minor speed bumps on the road of enterprise rollouts. So, why not kick back, ignore those pesky update notifications, and let your Kubernetes deployment bask in the warm glow of obsolescence? Just remember – living in the past is only fun until the ghosts of security vulnerabilities and outdated features come knocking on your door.
10.Embrace Impermanence (non-persistence): In the grand scheme of things, isn’t Kubernetes is supposed to be ephemeral? Why should your data be any different? Go ahead, live dangerously. Don’t bother with planning for data persistence in your Kubernetes rollout. Imagine the thrill of living on the edge, knowing that you could lose all your data the moment a pod goes down or the system crashes. Sure, you could use the Kubernetes Persistent Volume (PV) and Persistent Volume Claim (PVC) architecture to ensure your data survives even when your pods don’t, but where’s the fun in that? Data persistence is so pedestrian. Remember, the goal here is to stall your Kubernetes enterprise rollout, not to make it robust, resilient, and reliable. So, go ahead, and throw caution (and your data) to the wind. It’s only important business information after all, right?
But hey, here’s a novel idea – what if you actually wanted to succeed in your cloud-native strategy? I know, I know, it sounds a bit radical given our prior conversation. But bear with me. For those of you who enjoy sailing smoothly on the seas of enterprise IT, without the thrill of hitting every possible iceberg, Dell has created a glorious solution. A tool, that’s as much a life preserver as it is a nautical chart, guiding you safely through the treacherous waters of Kubernetes enterprise rollouts. This magic wand is called the Container Storage Modules (CSM).
This isn’t just any tool – it’s your co-pilot on the journey to a seamless Kubernetes implementation. It’s like having a Swiss army knife for enterprise data management. The CSM ensures that your data persistence strategies are as solid as a rock, ensuring that no pod crash or system failure can sweep your data into the abyss. With CSM, you can laugh in the face of data loss, secure in the knowledge that your enterprise information is safe and sound. So, for the daredevils who actually like to succeed in their endeavors, the Dell Technologies CSM is the perfect tool to ensure your Kubernetes enterprise rollout is as smooth and trouble-free as a hot knife through butter.
I hope this post proves helpful, regardless of which direction you choose for your enterprise cloud journey. If you’re inclined to thrill and enjoy the odd game of Russian roulette with your data, you now have some innovative strategies to stall your Kubernetes rollout. However, if your preference is smooth as a jazz tune and your data as secure as Dell’s Project Fort Zero, then Dell’s Container Storage Modules (CSM) is the tool you need. The CSM is your beacon in the foggy world of Kubernetes enterprise rollout, ensuring that no data loss or system failure can derail your cloud-native strategy. It’s your data’s best friend, your enterprise’s lifeline, and your ticket to a successful Kubernetes implementation.
Enjoy the journey, and remember – with the right tools and strategies, Murphy’s Law doesn’t stand a chance!
Kubernetes keeps increasing in popularity and not just in public cloud. It keeps making inroads into the on-premises market. This is creating the need for automation. In many Kubernetes environments you tend to find developers using CI/CD pipelines not just for their applications code for the Kubernetes objects that deploy the code in the cluster (ex: deployment, service …). This means that most of the automation needs are covered. However there are several instances where you might want to use automation tools (ex: Ansible) either to replace or to supplement CI/CD tools. By the way, I am not talking about the deployment of the Kubernetes cluster itself, which is a valid use case. I am talking about the things that you would normally do with the “kubectl” tool
While creating a new video for the IaC Avengers channel in Youtube I came across one such use case and this prompt me to investigate how to manage Kubernetes with Ansible. This article contains my lessons learned.
My use case is as follows. I wanted to expose the creation of namespaces in any cloud to end-users from ServiceNow. The idea is that rather than giving developers and other personas the right to create their own namespaces an organization would like to keep a central control plane where they can implement the much needed governance and cost transparency. This use case is very important in RedHat OpenShift environments because the general guidance is to share a few clusters as opposed to creating a cluster per tenant as other vendors recommend. Namespaces is the native mechanism to keep tenants separate with this approach
This “Multi-Cloud Kubernetes as a Service” is the latest in a growing set of demos that we have been creating for a while.
In this article we are going to cover:
Architecture
Installation in command line Ansible
Installation in AWX/Tower
A practical example
Architecture
We will use a single Ansible module for this solution: “kubernetes.core.k8s”, which might surprise many of you. At first when I was thinking about this solution I thought there would be multiple modules to manage all the different objects in the Kubernetes API: pods, deployments, secrets … but no, there is a single one. To put this into perspective let’s bear in mind that there are more than 150 different modules to manage all aspects of vSphere environments.
So why is there a single module for Kubernetes? At the end of the day Kubernetes and Ansible have much in common. Both frameworks use a declarative syntax where you express your desired state and then the system does whatever is necessary to implement your specified end state. Furthermore, they both use YAML files. So rather than creating multiple modules, you embed your each individual Kubernetes task manifest inside its own Ansible task. You need to watch out for the right indentations but that in essence how it works. We will see some examples in a later section
Another clever shortcut the creators of the module took is that the module doesn’t include its own Kubernetes client. Instead what the Ansible engine will do is to SSH into a machine that has “kubectl” and the “kubeconfig” installed. You could install “kubectl” in your Ansible system if you wanted (and use “localhost” as the target) but you don’t have to. In my case I have created a separate VM with “kubectl” and all the “kubeconfig” files for all clusters I am managing and the Ansible playbook is targeting that VM which is defined in the inventory. In OpenShift environments your Kubernetes client machine will need to run also the “oc” tool
In our video we assumed there will be multiple clusters available for different combinations of:
Cloud (vSphere based private cloud, AWS, Azure and GCP)
Production or development (You might want to have more like UAT …)
Different Kubernetes versions (v1.22, v1.23, v1.24)
The actual selections made by the user determine the target cluster in which to create the “namespace” (a.k.a “project” in RedHat parlance). The playbook takes the 3 parameters selected by the user and builds the name of the “kubeconfig” file to use. The Ansible module allows you to specify a “kubeconfig” file. From that point any tasks are run in the relevant cluster
The Ansible playbook allows you to specify also a “context”. At the beginning I started using a single “kubeconfig” with multiple contexts but as I kept adding clusters it was getting hard to manage. I think the “kubeconfig” method is easier. Every time you create a new cluster, grab the file, rename it to match the type/location of the cluster (ex: “aws-prod-22.config”) and place it in the directory where the client machine expects to find them and you are done
Installation in command line Ansible
The installation requires you to install things in both the Ansible and Kubernetes client system. With other modules you typically install some Python libraries as a prerequisite and then install the Ansible collection. A very important difference with the Kubernetes collection is the libraries are required in the Kubernetes client system, not in the Ansible system. Of course if you have decided to run the Kubernetes client in your Ansible system you will install everything in the same machine.
Before you start please make sure you are running Python 3.6 or higher in the client. In my case I started installing this in a system with CentOS7 which comes with Python 2.7 by default and I was getting errors until I did
ln -s /usr/bin/python3 /usr/bin/python
In terms of libraries you need the following in the Kubernetes client machine:
kubernetes >= 12.0.0
PyYAML >= 3.11
jsonpatch
In my case I just did “pip install kubernetes” and it installed everything else. OpenShift environments are better managed with the “oc” tool. For that reason you also need an additional library called “openshift”.
The ‘kubernetes’ library expects the kubeconfig file to be present in .kube/config. However, as we discussed earlier you can specify a different location and kubeconfig file name as part of the task inside the playbook
Now in the the Ansible machine you need to install the Ansible collection
ansible-galaxy collection install kubernetes.core
Finally, you will need to add your Kubernetes client to the inventory in the Ansible machine, This is mine:
The above syntax assumes that the kubeconfig is in the default location, i.e. ~/.kube/config in the home directory of the user running the playbook as in the kubernetes client system. Keep reading to see how to store the config in a different location
Installation in AWX/Tower
If we need to run the playbook in AWX or Ansible Tower, nothing of we discussed previously for the Kubernetes clients changes. So you still need the following in the client:
the Python libraries
a supported version of Python in the client
the “kubectl” tool (and “oc” if you are managing OpenShift clusters
However, on the Ansible system you need to:
create the inventory entry that points to the Kubernetes client system
install the “kubernetes.core” collection in the “task” container
create a job template as usual
This is how I installed the “kubernetes.core” collection in my AWX system. Notice how I install it in the “awx_task” container
However, when I went to trigger the job template I got this error
TASK [Create namespace in target Kubernetes cluster] ***************************
fatal: [172.24.167.53]: FAILED! => {"msg": "Could not find imported module support code for ansiblemodule.  Looked for either AnsibleTurboModule.py or module.py"}
I fixed it by installing the “cloud.common” collection also inside the “task” container:
[root@awx17 ~]# docker exec -it awx_task /bin/bash
bash-4.4# ansible-galaxy collection install cloud.common
Process install dependency map
Starting collection install process
Installing 'cloud.common:2.1.2' to '/var/lib/awx/.ansible/collections/ansible_collections/cloud/common'
A practical example
The example we are going to use will do 2 things:
create a namespace
assign permissions to the namespace to the user that requested the namespace
In this Kubernetes as a Service design the assumption is that developers and other personas they cannot create or join namespaces by themselves. This is achieved by creating a new namespace or joining an existing one. Hence the need to assign the relevant permissions in the playbook. A future blog post show the “join namespace” scenario which includes including the creator of the namespace in a ServiceNow workflow approval.
The first thing the playbook does is to figure out what kubeconfig file needs to be use. It does so by combining 3 pieces of information. In the video you can see how these details are provided by the user that is requesting the namespace in ServiceNow. They allow us to uniquely identify the Kubernetes cluster we have to use to apply the changes
  - name: Build the kubeconfig file name out of input parameters
    set_fact:
      configname: "{{ cloud }}-{{ envtype }}-{{ version }}"
So for example if the user selects “aws”, “production” and “1.22” the playbook will look for a file named “aws-prod-22.config” and run the remaining tasks on the cluster that is defined in that kubeconfig file. Note how we decided to drop the “1.” from the Kubernetes version to make the file names more streamlined. With this approach, onboarding a new cluster couldn’t be easier. Let’s say in the future we want to create a new development cluster in GCP that is running v1.25. All we need to do is grab the kubeconfig file and place it in the same directory as the other files in the client and rename it to “gcp-dev-25.config”. No further changes are required
Let’s take a look at the playbook
---
- name: Create a namespace in a kubernetes cluster
  hosts: kubectl01
  gather_facts: false

  vars:
    #nsname: ansible           # needs to be provided by end-user
    #version: 22               # corresponds to k8s version 1.22, 1.23 ...
    #envtype: dev              # type of environment: prod, dev ...
    #cloud: vsphere            # vpshere, gcp, aws ...
    #snow_username: finance1   # this comes also in the API call
    #backup_type: gold         # user needs to choose between gold/silver policies

  tasks:
  - name: Build the kubeconfig file name out of input parameters
    set_fact:
      configname: "{{ cloud }}-{{ envtype }}-{{ version }}"

  - debug:
      msg: "Let's create namespace {{ nsname }} with kubeconfig {{ configname }}.config"

  - name: Create namespace in target Kubernetes cluster
    kubernetes.core.k8s:
      state: present
      kubeconfig: "~/.kube/{{ configname }}.config"
      kind: Namespace
      name: "{{ nsname }}"
      definition:
        metadata:
          labels:
            backuptype: "{{ backup_type }}"
            snowowner: "{{ snow_username }}"

  - name: Create role binding for user {{ snow_username }}
    kubernetes.core.k8s:
      state: present
      kubeconfig: "~/.kube/{{ configname }}.config"
      definition:
        kind: RoleBinding
        apiVersion: rbac.authorization.k8s.io/v1
        metadata:
          name: "{{ nsname }}-owner"
          namespace: "{{ nsname }}"
        subjects:
        - kind: User
          name: "{{ snow_username }}"
        roleRef:
          kind: ClusterRole
          name: admin
I have commented out all the variables required as they are being passed as parameters but you can remove the comments when you are testing the playbook
Pay close attention to the “definition” section in the “role binding” task. If you took everything that follows, insert it into a YAML file and use “kubectl apply” it accomplish the same thing. This is what I was referring to about the beauty of how the creators have designed the Ansible module
Notice how we are adding 2 labels to the namespace. These will be used for the “join namespace” workflow and for automatically adding the namespace to a backup policy in PPDM (PowerProtect Data Manager). We will cover these two features in future posts
The “snow_username” is the username of the user that places the request in ServiceNow. In our demo we used KeyCloak to create in seamless authentication infrastructure across ServiceNow and the rest of our infrastructure including OpenShift
Finally, notice how we are binding the default “admin” role to the user, but restricted to the namespace, which is what you would expect from an owner. However, by the rules of least privilege, if you wanted to you could restrict to whatever you need by defining a specific role. You could potentially create this role at the only once at the cluster level. In that case it wouldn’t need to be part of this playbook. We will use this technique for offering various roles in the “join namespace” workflow. The following code is an example for a “deployment manager” role in a specific namespace
  - name: Create a new role for deployment managers
    kubernetes.core.k8s:
      state: present
      kubeconfig: "~/.kube/{{ configname }}.config"
      definition:
        kind: Role
        apiVersion: rbac.authorization.k8s.io/v1beta1  #rbac.authorization.k8s.io/v1
        metadata:
          namespace: office
          name: deployment-manager
        rules:
        - apiGroups: ["", "extensions", "apps"]
          resources: ["deployments", "replicasets", "pods"]
          verbs: ["*"]
I hope you found this helpful. Keep an eye on the follow up video and the two follow up blog articles
This is part 2 of a small series we started to show some techniques that allow us to build a hierarchy of dashboards with Grafana. In the first part we learnt how to create links both at the panel and at the dashboard level. In this article we are going to explore how to create health status metrics that we can use in our “Top” level dashboard to get an at-a-glance view of a single system. Our dashboard will likely have one of these for every system being managed
Producing a health metric is going to require some basic math. The question is “where” do we do these calculations. Even though the calculations are not necessarily complicated the general guidance is not to do them in Grafana. What we are going to show here is how to calculate the health score as we take the measurement. Then we will store the health data along with the sensor data into the time series database as it is produced. If you want to do this in Grafana you might want to explore the “Expressions” functionality, but at a time of writing is a beta feature and you get warned that it might not be there in future versions.
I will provide some sample scripts in Python. If you don’t use Python in your environment, it doesn’t matter as the main thing now is to focus on the actual logic. In order to work with sample data we are going to create some random numbers for 3 different metrics representing the environment conditions of a certain location (a warehouse, a lab …). These metrics will be fake temperature, humidity and noise readings but you could use different metrics for your use case. Also not that the time series database we are using is InfluxDB, which is very popular these days.
When we calculate a health metric that summarizes all these readings we have 2 options.
Combine all metrics into one
Use the health of the worse metric
Combine all metrics into one
In this method we start with the maximum health value and then discount health points as you parse the data to find out the current health. Note how I have used 10 as the top health score. Other use cases might benefit from using 100 as the top score in which case you can interpret the health number as a percentage
import time
import random
from influxdb import InfluxDBClient
inf_db = "iot_database"
client = InfluxDBClient(host='localhost', port=8086)
client.switch_database(inf_db)

for x in range(10000):
    i = random.randint(20,45) # temperature reading
    j = random.randint(40,80) # humidity reading
    k = random.randint(40,60) # noise reading

    # Let's calculate the health based on the current readings
    health = 10 # Start with max possible health and substract from there
    if i > 30: health -= 1
    if i > 40: health -= 2
    if j > 60: health -= 1
    if j > 70: health -= 1
    if k > 50: health -= 1

    data = 'lab Temperature={},Humidity={},Noise={},Health={}'.format(i,j,k,health)
    print str(x).zfill(4) + " : " + data
    client.write([data],{'db':inf_db},204,'line')

    time.sleep(5)
Notice how I am taking health points if temperature is high and then take extra points if it is even higher. In my opinion this produces simpler code than doing double conditions such as “if i < 40 and i < 30”
We can add more penalty to metrics or conditions that are more severe. For example notice how temperatures over 40 take 2 extra points instead of 1.
If you have many metrics contributing to health and all of them are taking many points away you might end up with negative numbers. You might add another line of code that turns health to 0 if the calculated value is a negative number
We run the code and we get the following output. As we are using random numbers we get metrics swinging very wildly but it is a good thing in this case because we can see how the health parameter is reacting
The “Health” metric is numerical so if we want to use a “stat” panel with status such as “OK” or “CRITICAL” we will need to use “Value Mapping” in Grafana. First let’s create a panel in the “Top” level dashboard. Make sure is of the type “stat”. You can configure the “query” as follows. Notice the “FORMAT AS Table”:
Then go to the “settings” in the right-pane and scroll-down to “Value mappings”. You can configure your value mappings as follows. Don’t forget to set the “Display text” and the “Color”
We can then get out of panel editing mode and observe how our “stat” panel behaves. Notice how I have added a link to another dashboard that shows the actual time series for all the variables as described in the previous post.
Since we are representing “Health” by a number, another way of presenting it in our “Top” level dashboard is with a “Gauge” panel. These types of panels are also very visual as they show you the current value in relation with the minimum and maximum values in the range. Let’s add a new “Gauge” panel and configure the query as follows, notice how we are now using “FORMAT AS Time series”
For a “Gauge” it is important to define the range of possible values. In our case this is 0 and 10 as shown below. If you have defined your health metric as a percentage you can set the range from 0 to 100 and select “Percent(0-100)” in the “Unit” field
If we get out of edit mode the changes are made right away and our new “Gauge” panel looks like this
You can also use value mapping to show a health label instead of the health number, which along with the color conveys a very clear message. In the screenshots below I am using the same “Value mappings” we used for the “Stat” panel above
Use the health of the worse metric
Another way of calculating a metric would be to pick up the status of the worst metric. This approach is more conservative and it has its merits. The first thing we need to do is to calculate a different health score for each metric and then select the worst one as the overall health of the whole system. You can see some sample Python code below to illustrate the concept
import time
import random
from influxdb import InfluxDBClient
inf_db = "iot_database"
client = InfluxDBClient(host='localhost', port=8086)
client.switch_database(inf_db)

for x in range(10000):
    i = random.randint(20,45) # temperature reading
    j = random.randint(40,80) # humidity reading
    k = random.randint(40,60) # noise reading

    # Let's calculate the health based on the current readings
    temp_health  = 10
    humi_health  = 10
    noise_health = 10

    if i > 40: temp_health -= 2
    if i > 30: temp_health -= 1
    if j > 70: humi_health -= 1
    if j > 60: humi_health -= 1
    if k > 50: noise_health -= 1

    # Now let's pick the metric with the smallest value
    health = min(temp_health, humi_health, noise_health)

    data = 'lab Temperature={},Humidity={},Noise={},Health={}'.format(i,j,k,health)
    print str(x).zfill(4) + " : " + data
    client.write([data],{'db':inf_db},204,'line')

    time.sleep(5)
As before you could put more weight on a given metric if a bad situation on that subsystem tends to produce more critical situations. In our example you can see how we are discounting more health points in Temperature than the other 2 metrics
This is a sample output of the script
Notice how the last 2 intervals produce the same overall health status of 9 based on very different conditions. In interval “0006” the Temperature threshold was exceeded. Whereas in “0007” it was the humidity threshold that determined the “Health” value.
It took a while to decide the title of this post but I am still unsure whether it conveys the purpose of the post. The point is that we all start our Grafana journey by creating some cool graphs in a dashboard, but after a while we typically end up with many many dashboards … so eventually we start looking for an at-a-glance view that summarizes all our dashboards. Think of one of those dashboards that use at the operations centers
We are going to explore some techniques that enable you to build such a hierarchy in Grafana:
The objective is to have a top level dashboard that summarizes all the others. We also need a way of bringing up those other second level dashboards if we want more detail about a specific system. In this section we will see how to create links in Grafana.
In my environment I have 2 dashboards:
Top. This is my pretend top level dashboard that will contain the at-a-glance view of all my monitored systems. This dashboard is likely to contain “Stat” panels (and maybe gauges) showing the overall status of multiple systems
Second. This is a dashboard that contains details about a specific system and as such is likely to contain time series, chart panels and other sophisticated visualizations
In Grafana you can create links at the panel level and the dashboard level
Panel Links
The main idea here is that if I click on one of the stat panels it will take me to the second level dashboard where I can see all the details. Maybe the stat panel is showing a red colored “CRITICAL” message and by clicking on it I can go to the second level and see what subsystem is causing the issue.
In my “Top” level dashboard I have currently a single Stat panel that shows us the health of a certain location, a “warehouse” in this case. There will be some metrics that we aggregate to produce this “health”. In the next article we will explore how to do that. For now this is how it looks:
Dashboards in Grafana are displayed in a browser by using their URL. This includes a unique ID as well as the actual name as you can see in the following screenshot. You will need to record the URL of the “second” level dashboard so go ahead, open the “second” level dashboard and record its URL.
Once you have the URL you can go to the Top level dashboard and define a link on the “Warehouse” health stat panel. Then go to the Options section in the right pane and select “Panel links” and then “Add link”
Here you can add a title for your link and the URL of the second level dashboard we save in the previous step. Optionally you can choose to open the second dashboard in a new tab. Click “Save” and get out of Edit mode
Now, in the “Top” level dashboard you can see a little arrow icon on the top-left corner of the Stat panel. If you hover your mouse over it you will see the title of the link you provided. And when you click on it it will open the second level dashboard
Dashboard Links
The other alternative is to create dashboard links. These will permanently display at the top-right corner of your dashboard.
Let’s go ahead and create 2 dashboard links:
Link to other dashboards
Link to an external site
Start by opening the dashboard settings. You will find the icon at the top-right corner of the dashboard
Then click on “Links” on the left and then “New Link”. Let’s create a link called “Dashboards”. The “Title” is the string that will be clickable. For “Type” we select “Dashboards”. If you only have a handful of dashboards they will all display in the same line. However if you are planning to have many, it’s better to tick the “Show as dropdown” checkbox to things neater.
Considering this “Top” level dashboard is likely to show in an operations center, another use case would be to have handy some links related to support, such as an internal ticketing system, a vendor support site or a list of emergency contacts. Now let’s go ahead and create another link that links to the support page of a vendor so that we can open a service request. This time we will select the “Link” type and provide the URL to open when clicked. You can customize the link by selecting an “icon” that is meaningful for your use case. Notice how I have also force it to open the linked page in a “new tab” as we want our dashboard to remain open after we are done with the service request
This is what the “Links” menu in dashboard “Settings” looks like with both links configured
Finally “Save Dashboard” and once in the dashboard you should see something like this. Notice how I have clicked in the “Dashboards” button and the existing dashboards (which is only “second” in this case) are shown
In the next article we will focus on how to create aggregate multiple metrics into a overall health number.
Grafana has become a very popular tool for monitoring systems and applications partly due to the amount of features and integrations it provides. The graphs it produces are beautiful. However sometimes you need to show a string or a value instead of a full graph. For that purpose Grafana provides the “Stat” panels. These are very often used to show a single value, such as the last reading or the moving average of a given metric.
However sometimes you want to display a string. An example of this could be a “health” status, such as OK or CRITICAL
or it could be some some other message you are collecting such as this
We are going to show how to handle this scenario but for completeness let’s use some Python code. In this example we will be collecting some environment data and storing it into InfluxDB. On every interval we are going to:
read 2 numerical values (Temperature and Humidity)
infer a “Health” text value by comparing the 2 previous values against some threshold
write all 3 values to the database
The code requires you to install the “influxdb” Python library. You can do so with “pip install influxdb”
# Import the Influx client from the Python library
from influxdb import InfluxDBClient

# Create a connection to InfluxDB
client = InfluxDBClient(host='localhost', port=8086)

# Connect to the right database
inf_db = "iot_database"
client.switch_database(inf_db)

while True:
    # Read the data from your sensors or a REST API ...
    # Let's say we got:
    temp = 25
    hum  = 60

    # Depending on some predefined thresholds we could derive the Health
    if temp < 35 and hum < 80:
        h = "OK"
    else:
        h = "CRITICAL"

    # Then we write the data
    data = 'warehouse Temperature={},Humidity={},Health={}'.format(temp,hum,h)
    client.write([data],{'db':inf_db},204,'line')

    # Pause for 5 seconds until the next iteration
    time.sleep(5)
Now let’s see how we can use the “Health” text value in Grafana. Add a “Stat” panel to your dashboard and on the query section you need to “format as table” and select the “last” value.
At this point the panel will still display “No data”. So you need to go to the “Options” section on the right pane and scroll down to “Fields”. By default, “Numeric Fields” will be selected, but you need to select “last”
Additionally you might want to set “Graph mode” to “None”. By default Stat panels will want to show a graph as well as the value but in this case there is no graph anyway because the “Health” field is not numerical.
Finally you might want to apply a color code to the text in your “Stat”. Unfortunately threshold-based coloring won’t work because Health contains not numerical values. Don’t despair, we can still color them to our liking by using “Value mappings”. You will find this option at the very bottom of the “Options” pane.
You can add a “new value mapping” for each type of health status your code is producing, ex: OK, CRITICAL … Specify the value to match on the left and the color on the right as shown above
In our simple code we had only 2 different health status hence our resulting value mappings is as follows
So now when the sensor data is above the threshold we write Health = CRITICAL and it displays as follows:
In a future post I will share some tips to build a hierarchy of dashboards including a front dashboard to be used in your control center with a visual snapshot of your entire operation
In this blog post, we will install Dell EMC PowerStore collection on Ansible AWX and go through the next steps.
As we all know that Ansible has moved to Collections – a new ways of managing integrations and content management. Dell EMC has already started working towards this and have released several collections for multiple Dell EMC portfolio products, few of which are listed below.
Apart from this list you can find other Dell portfolio collections (like OpenManage) on this link
For the scope of this blog post we will focus on installing Dell EMC PowerStore Ansible collection on Ansible AWX. Technically, all the collections can be installed using similar steps.
As a Pre-Requisite, this blog post assumes that you have –
Access to operating system / machine having Ansible AWX installed
Access to PowerStore storage system (with credentials)
Additionally, if you’re getting started with Ansible AWX and/or integration with Dell EMC’s storage products then you can follow this blog series to get started from scratch.
As part of the installation collection installation steps we need to Ansible AWX machine and then connect to the awx_task docker container.
Login to the AWX machine. You can list the running AWX containers using below command
[root@awx ~]# docker container list
CONTAINER ID        IMAGE                     COMMAND                  CREATED             STATUS              PORTS                  NAMES
6ced2eccbd7b        ansible/awx_task:11.2.0   "tini -- /bin/sh -c …"   13 months ago       Up 6 days           8052/tcp               awx_task
42b14fbd15ad        ansible/awx_web:11.2.0    "tini -- /bin/sh -c …"   13 months ago       Up 6 days           0.0.0.0:80->8052/tcp   awx_web
4c08c0e39128        memcached:alpine          "docker-entrypoint.s…"   13 months ago       Up 6 days           11211/tcp              awx_memcached
42224676c21a        redis                     "docker-entrypoint.s…"   13 months ago       Up 6 days           6379/tcp               awx_redis
37d0ca0c67bc        postgres:10               "docker-entrypoint.s…"   13 months ago       Up 6 days           5432/tcp               awx_postgres
Then connect to the awx_task container using below command
# docker exec -it awx_task bash
Next, install the PowerStore Ansible Modules collection in awx_task container
# ansible-galaxy collection install dellemc.powerstore
Process install dependency map
Starting collection install process
Installing 'dellemc.powerstore:1.2.1' to '/home/awx/.ansible/collections/ansible_collections/dellemc/powerstore'
Then logout from the container.
bash-4.4# exit
Now you have successfully installed the Dell EMC PowerStore Ansible Modules collection. Next step post installing collection are
Create the PowerStore credentials on the Ansible AWX
All Dell EMC’s published collections comes with sample playbooks to test the functionality and also to get you started with integrations. When it comes to PowerStore you can see them under /home/awx/ansible-powerstore/dellemc_ansible/powerstore/samples directory
# cd /home/awx/ansible-powerstore/dellemc_ansible/powerstore/samples
# ls -l
-rw-r--r-- 1 root root 1892 Jun  4  2020 capacity_volumes.yml
-rw-r--r-- 1 root root 1042 Jun  4  2020 create_multiple_volumes_async.yml
-rw-r--r-- 1 root root  799 Jun  4  2020 create_multiple_volumes.yml
-rw-r--r-- 1 root root  790 Jun  4  2020 delete_multiple_volumes.yml
-rw-r--r-- 1 root root 1710 Jun  4  2020 find_empty_volume_groups.yml
-rw-r--r-- 1 root root 1141 Jun  4  2020 search_volumes.yml
You can re-use these sample playbooks to quickly get started with storage automation tasks. Sample playbooks in the collection has multiple variables like –
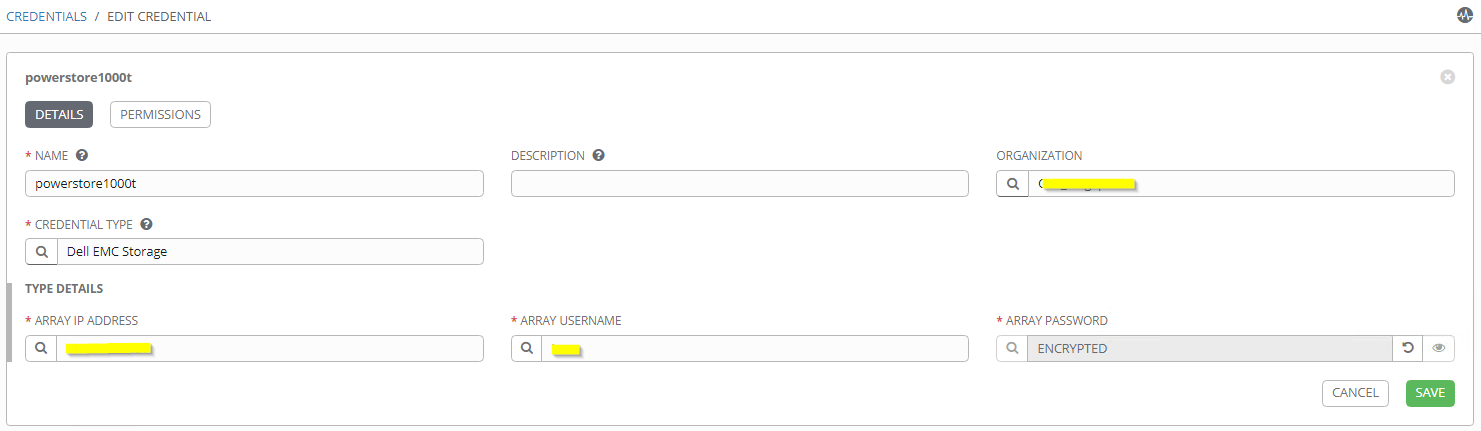
Once Dell Storage credential type is created then you can add PowerStore array details and credentials using AWX credential manager.
Ansible AWX – Dell EMC Storage Credential
After adding PowerStore credential you can use the same in the AWX automation job template creation. Additional variables (like volume names, size, host etc.) can be captured using extra_vars
Ansible AWX – Job Template Creation
Additionally you can create survey to capture the required variables and also workflow visualizer to create multi-step breakdown of the automation tasks including but not limited storage automation. Below is the example of breaking down the storage provisioning workflow in the logical steps (like approval, quota management, provisioning, etc.)
Ansible AWX – Workflow Visualizer
Hope this helps everyone.
Update: Please note that the latest version of AWX has moved to Kubernetes (instead of Docker). Please use the below steps to install the PowerStore modules.
[root@awx ~]# kubectl -n awx exec -it awx-844c574f84-bc4ww -c awx-ee -- /bin/bash
bash-4.4$ ansible-galaxy collection install dellemc.powerstore -c
Starting galaxy collection install process
Process install dependency map
Starting collection install process
Downloading https://galaxy.ansible.com/download/dellemc-powerstore-1.6.0.tar.gz to /home/runner/.ansible/tmp/ansible-local-3648wbuk4c_/tmprzm8bse6/dellemc-powerstore-1.6.0-ltamh_71
Installing 'dellemc.powerstore:1.6.0' to '/home/runner/.ansible/collections/ansible_collections/dellemc/powerstore'
dellemc.powerstore:1.6.0 was installed successfully
bash-4.4$
There are many use cases where VxRAIL manager, VMware vCenter Console, or vSuite will not be enough for your goals in mind. So, for monitoring and management of your VxRAIL cluster, you can utilize the VxRAIL REST API for achieving your end goal in mind.
There are multiple ways to get your hands around the VxRAIL REST API
VxRAIL Swagger UI is always (default) runs on the VxRAIL cluster and can be accessed using a browser. Link for accessing the VxRAIL Swagger UI is – https://<VxRAIL_Manager_IP>/rest/vxm/api-doc.html
VxRAIL – Swagger UI
From the Swagger UI (top right – Select a definition drop-down) you can select the categories of API calls. By default, Swagger UI opens into the Day 1 Bring Up Configuration.
Additionally VxRAIL Swagger UI allows you to play with the APIs on the same page. For this you’ll need to Authorize the page using VxRAIL manager credentials. This is to make sure that user is restricted to the right level of authorization based on their user type.
For executing / trying the APIs on the VxRAIL cluster you can simply choose the definition from the drop-down. In this case I’ve selected Cluster definition.
VxRAIL – Select Definition
If you expand the selected API it will show you multiple sections (Cluster Information in this example)
VxRAIL – Cluster Information
Parameters – Some APIs needs parameters as input for the successful exectution. If applicable they will be listed here
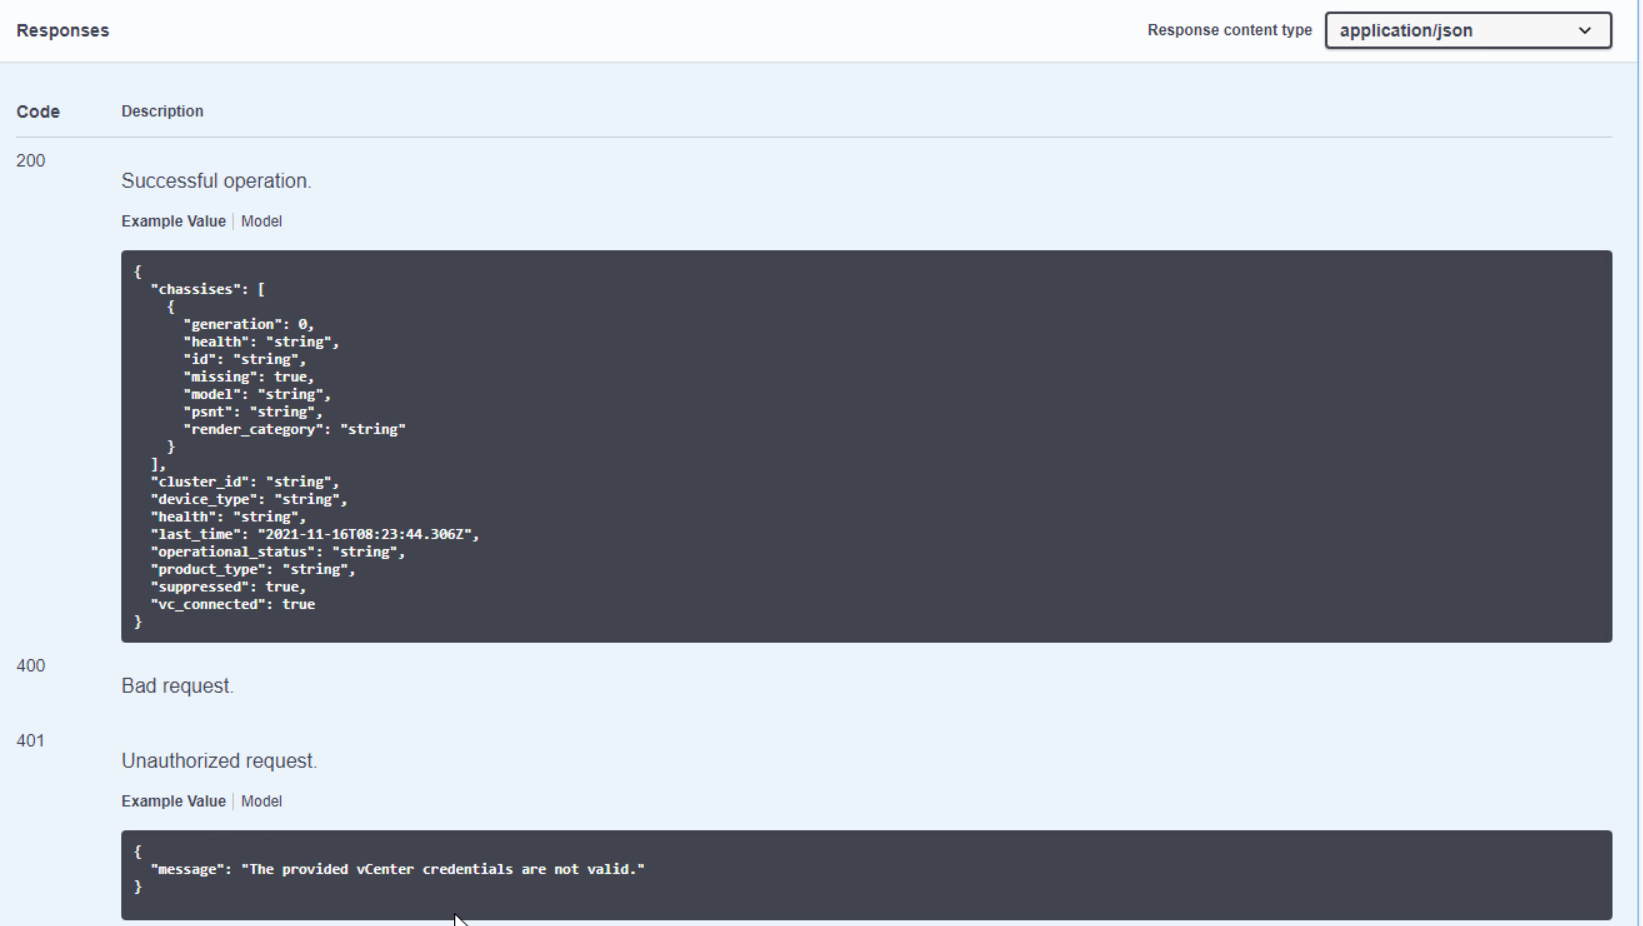
Responses – This section shows you the possible response codes for selected API with example output snippet.
When you click on the Try it out button page gets into the run-mode. Once you enter required parameters (not required in this example) you can click on Execute. At this point request will be sent to VxRAIL manage and response (body and headers) will be shown on the same screen.
Way Forward
I hope this gave you the high level overview of VxRAIL APIs and how to access them. Though Swagger has built-in option to try the APIs, but that is the just a API explorer tool. Additionally you can also use the REST clients – like Postman – to interact with the API. Eventually you’ll integrate these APIs with your automation tools – those can be VMware vRA, Ansible, Terraform, or it can be your own developed tool. Technically speaking you can use any tool as far as it has option to interact with REST API.
The very first thing to do when working with a REST API is to get your hands on the reference guide and hopefully the getting started guide if there is one. The first thing to look for is how to authenticate with the API and whether there are any requirements for special headers or things like that. Afterwards things tend to flow faster and easier. Fortunately, ServiceNow supports basic authentication so there is no learning curve there, although it does support more secure authentication through OAuth if you need it
In terms of documentation the online help is great. Here you can get an overview of the API. And this is the starting point for the online REST API reference. There are many branches or child API’s hanging of this root. In the screenshot below you can see how, for every call, the online help shows the URL (default or for a specific version) and parameters (path, query and request body). Further down it shows headers for the request and the response and even two coding examples for curl and python … as complete as it gets
But the tool you will learn to love very quickly is the “REST API Explorer”. Please note that this is a tool that you can only access from within your instance. Once you log in go to “System Web Services” and then locate “REST API Explorer” as shown here
You will then end up with a menu like this. Notice how you can select the specific child API in the top-left corner and the version of your environment.
ServiceNow stores all data in tables. This is also true for Incidents which unsurprisingly are stored in the “incident” table. To manipulate tables we need to use the Table API. Different HTTP methods will enable us to do the various CRUD operations. For example if we want to create an incident we will have to use the POST method. Notice in the previous image how I have selected the “Table API” and within that API the “Create a record (POST)” call. Then on the right I have selected the “incident” table.
When you scroll down you can see a dialog that allows you to build the request body for the incident creation. With the drop-down menu you can select from all the available fields. As you select new fields and assign values, the REST API Explorer builds the body for you in the text box immediately below. At the very bottom you can generate code in multiple languages
We have grouped the API calls we are using in this article into a Postman collection. You can download the collection from the following the following GitHub repo :
The collection uses 2 variables that you must add to an environment. If you are new to Postman environments check out this older article:
{{pwd}}. This is the password for the “admin” user of your ServiceNow instance. If you need to use a different user, you can change it in the collection settings
{{instance}}. This is your ServiceNow instance name, i.e. excluding the “.service-now.com” suffix. If you don’t have one or you cannot test this with your production instance, you can open your very own developer instance with ServiceNow
The collection provides 4 calls and a saved example for each call:
Get details for all incidents. This will produce a 98 line JSON structure for each incident
Get details for a single incident. This requires you to pass the “sys_id” of the incident as part of the URL as shown below. You can get the “sys_id” for a specific incident from the body of the response during the creation (POST) operation
Create incident (POST). The JSON Body parameter can take “a lot” of fields but you can start small. For example the following Body produces the incident below:
Modify incident (PUT). This will allow you to make changes to incidents. In particular you can use it to resolve/close incidents by setting the state to “7” as shown in the screenshot below. This call also requires you to pass the “sys_id” of the incident you are modifying as part of the URL
In this article we have used the REST API to interact with ServiceNow because this is the way I will do it in the upcoming video demo. But depending on what you are trying to do you might want to use Ansible. In that case you can use the official Ansible modules provided by ServiceNow themselves. The collection is available in Ansible Galaxy and provides just two modules designed to interact with ServiceNow tables. Follow the instructions in the Ansible Galaxy page to install the dependencies including the “pysnow” Python library