Category: REST API

  • A Reference Architecture for Agentic ITSM: Wiring GenAI into ServiceNow Without Losing Control

    A year ago I wrote about integrating generative AI into ITSM workflows. Back then, “integration” mostly meant a chatbot that summarized tickets and drafted responses. Useful, but bounded — the model suggested, a human acted.

    That line has moved. The interesting question in 2026 isn’t whether GenAI can read a ticket; it’s whether you can safely let it close one. The moment a model can take actions in your system of record — reassign an incident, run a diagnostic, restart a service, request a change — you’ve crossed from “assistant” into “agent.” And agents in production are an infrastructure and governance problem long before they’re a model problem. This is the clearest case I know of a principle I keep coming back to: AI fails in the operating model, not the model.

    This post is the reference architecture I’d stand up to do agentic ITSM properly: enough autonomy to actually save time, enough control that I’d let it near a production ServiceNow instance. I’ll show the components, the wiring, the code that matters, and — more importantly — the parts everyone underestimates.

    The failure mode we’re designing against

    Most agentic pilots fail the same way. Someone connects a capable model directly to an API with broad credentials, it works beautifully in the demo, and then in week three it confidently takes a wrong action on a real incident because a retrieved document was stale and nothing stopped it. The problem was never the model’s intelligence. It was that the architecture had no seam between “the model decided” and “the system did.”

    Which is the whole point in one line: the tool is not the transformation. A more capable model doesn’t close this gap — it just takes the wrong action more fluently. Everything below exists to create that seam.

    The reference architecture

    Five layers, each with a single responsibility. The discipline is keeping them separate — that separation is what makes the system auditable, testable, and safe to evolve.

      Trigger  (new/updated incident, chat, webhook)
         |
         v
      Retrieval Layer      RAG over KB, CMDB, past incidents
         |
         v
      Orchestration Layer  agent loop + tool-calling
         |
         v
      Policy & Guardrail Gate  --- restricted / low confidence --->  Human-in-the-loop
         |                                                            (approval queue)
      allowed + high confidence                                            |
         |                                                              approved
         v  <-------------------------------------------------------------+
      Action Layer  (scoped ServiceNow API)
         |
         v
      Observability  (traces, evals, audit log)  --->  back to Trigger

    1. Retrieval Layer. The agent is only as good as what it knows about this incident. Ground every decision in your own data: the knowledge base, the CMDB (what is this CI, what depends on it), and — the highest-signal source most teams ignore — the resolution history of similar past incidents. Retrieval quality, not model size, is usually the difference between a useful agent and a plausible-sounding one.

    2. Orchestration Layer. The agent loop: given the incident and retrieved context, decide the next step, optionally call a tool, observe the result, repeat until resolved or escalated. This is where model-provider choice lives — and it should be swappable, not hardcoded.

    3. Policy & Guardrail Gate. The seam. Every proposed action passes through a deterministic policy check before it can touch ServiceNow. This layer is plain code, not a model — because “what is this agent allowed to do” is a decision you must be able to read, test, and audit, not one you delegate to a probability distribution. This is where your operating DNA — how decisions get made and who is trusted to act — stops being culture and becomes code.

    4. Action Layer. A narrow, scoped adapter to ServiceNow. It exposes only the specific operations the agent is permitted to perform, each backed by a least-privilege service account. The agent never gets your admin token.

    5. Observability. Full traces of every decision, tool call, and action; an immutable audit log; and continuous evaluation. If you can’t answer “why did the agent do that, and was it right,” you can’t run this in production.

    The seam, in code

    Here’s the heart of it: the orchestration layer proposes an action, and the guardrail gate decides whether it executes, gets downgraded to a human approval, or is refused. This is deliberately boring, deterministic code — that’s the point.

    from dataclasses import dataclass
    from enum import Enum
    
    class Decision(Enum):
        ALLOW = "allow"
        REQUIRE_APPROVAL = "require_approval"
        DENY = "deny"
    
    @dataclass
    class ProposedAction:
        name: str            # e.g. "restart_service", "reassign", "add_work_note"
        target_ci: str       # configuration item the action touches
        params: dict
        confidence: float    # model-reported, treated as a hint, never as truth
    
    # Policy is data you can read, diff in git, and audit — not model output.
    POLICY = {
        "add_work_note":   {"max_blast_radius": "none",   "min_confidence": 0.0},
        "reassign":        {"max_blast_radius": "ticket", "min_confidence": 0.75},
        "restart_service": {"max_blast_radius": "service","min_confidence": 0.90,
                            "require_approval_for": ["prod"]},
        # default-deny: anything not listed cannot run
    }
    
    def evaluate(action: ProposedAction, ci_env: str) -> Decision:
        rule = POLICY.get(action.name)
        if rule is None:
            return Decision.DENY                      # default deny — the safe default
        if action.confidence < rule["min_confidence"]:
            return Decision.REQUIRE_APPROVAL
        if ci_env in rule.get("require_approval_for", []):
            return Decision.REQUIRE_APPROVAL
        return Decision.ALLOW

    Three design choices are doing all the work here:

    • Default deny. An action the policy doesn’t explicitly know about cannot run. New capabilities are added deliberately, in a reviewed change to the policy, not discovered by the model at runtime.
    • Confidence is a hint, never a gate on its own. A model saying it’s 0.99 sure is not evidence. Confidence lowers autonomy when low; it never grants autonomy on its own. High-blast-radius actions in prod route to a human regardless.
    • Blast radius is explicit. Every action is classified by what it can break. That classification, not the model’s eloquence, determines how much oversight it gets.

    The action layer itself stays thin and scoped:

    import os, requests
    
    class ServiceNowAdapter:
        """Exposes ONLY whitelisted operations, backed by a least-privilege account."""
        def __init__(self):
            self.base = os.environ["SN_INSTANCE_URL"]
            self.auth = (os.environ["SN_AGENT_USER"], os.environ["SN_AGENT_TOKEN"])
    
        def add_work_note(self, sys_id: str, note: str):
            return self._patch(sys_id, {"work_notes": note})
    
        def reassign(self, sys_id: str, group: str):
            return self._patch(sys_id, {"assignment_group": group})
    
        def _patch(self, sys_id: str, body: dict):
            r = requests.patch(f"{self.base}/api/now/table/incident/{sys_id}",
                               json=body, auth=self.auth, timeout=10)
            r.raise_for_status()
            return r.json()

    Notice what’s not here: there’s no generic “run arbitrary query” or “execute” method. The agent’s power is defined by the surface area of this class, and that surface area is a design decision you make on purpose.

    Deploy it like infrastructure, not like a notebook

    The fastest way to lose trust in an AI system is to run it as a hand-configured process someone SSHed in to start. Treat the whole stack as infrastructure-as-code from day one — reproducible, version-controlled, and reviewable. The service account, its exact permissions, the policy file, and the deployment all live in git:

    # ansible: provision the least-privilege ServiceNow integration account
    - name: Ensure agent service account has ONLY scoped roles
      vars:
        agent_roles:
          - itil            # read/update incidents
          - snc_read_only   # broad read, no write
      ansible.builtin.uri:
        url: "{{ sn_instance }}/api/now/table/sys_user_has_role"
        method: POST
        user: "{{ sn_admin_user }}"
        password: "{{ sn_admin_pass }}"
        body_format: json
        body:
          user: "{{ agent_sys_id }}"
          role: "{{ item }}"
      loop: "{{ agent_roles }}"
      # No admin, no security_admin. If the agent needs more, that's a reviewed PR.

    The point isn’t Ansible specifically — it’s that “what can this agent touch” should be a diff someone approved, not tribal knowledge.

    The parts everyone underestimates

    Evaluation is the hard part, not orchestration. Wiring an agent loop is a weekend. Knowing whether it’s getting better or worse over time is the real engineering. Build a regression set of real (anonymized) incidents with known-good resolutions and run it on every prompt or model change. Without this, every “improvement” is a guess.

    Retrieval decay will hurt you silently. A KB article gets superseded, a CMDB relationship changes, and the agent starts grounding decisions in stale truth — confidently. Freshness and provenance on retrieved context matter more than the model you pick.

    Cost is an architecture decision. Running a frontier model on every ticket update is how pilots die in the budget review. Route by difficulty: cheap/local models for triage and summarization, the expensive model only for genuinely ambiguous cases. Inference routing belongs in the design, not the invoice.

    Human-in-the-loop is a feature, not a fallback. The approval queue isn’t the system admitting defeat — it’s the mechanism that lets you start with tight autonomy and earn more as the eval data proves the agent is trustworthy for a given action class. Every autonomy level you grant is a conviction with a review date: stated strongly enough to act on, dated explicitly enough that your eval data is allowed to revise it.

    How I’d actually roll this out

    1. Shadow mode first. The agent proposes actions and writes them to work notes, but executes nothing. You get real eval data at zero risk.
    2. Graduate low-blast-radius actions. Let it add work notes and reassign autonomously once shadow-mode accuracy clears your bar.
    3. Keep high-blast-radius actions human-gated — indefinitely, if that’s what the risk math says. But don’t hide behind the gate forever, either: shadow mode with no graduation path is its own failure mode — professional neutrality, saying a great deal while committing to nothing. The discipline is interpretive courage: reading the eval data everyone can see and making the call to graduate an action when it has earned it.
    4. Instrument everything from step one. You cannot retrofit observability onto an incident you can’t explain.

    The takeaway

    Agentic ITSM is not a model you buy; it’s a system you architect — because, again, AI fails in the operating model, not the model. The model is the least differentiated part — it’s swappable, and it’s improving whether you do anything or not. Your durable advantage is the seam: the deterministic, auditable, least-privilege layer between what the agent decides and what your systems actually do. Get that right and you can adopt every model improvement safely for years. Skip it and you’ve built a very expensive way to take the wrong action quickly.

    Flexibility with guardrails is the real competitive advantage in enterprise AI. Is your architecture ready to let an agent act — or only to let it talk?

    The policy-gate, ServiceNow-adapter, and provisioning code from this post are runnable on GitHub: github.com/waghmaredb/vexpose-labs. If you’re building agentic workflows on your ITSM stack, I’d like to compare notes — reach me on LinkedIn or X.

  • Integrating Generative AI in ITSM Workflows

    Integrating Generative AI in ITSM Workflows

    IT Service Management (ITSM) teams are increasingly turning to generative AI (GenAI) to streamline workflows, reduce resolution times, and improve user satisfaction. In this post, we’ll explore two architectures for integrating GenAI into platforms like ServiceNow: man-in-the-middle (human-in-the-loop) and agentic automation (autonomous AI agents).


    Why GenAI for ITSM?

    • Ticket overload: Teams handle hundreds of tickets daily, leading to burnout and delays.
    • Knowledge gaps: Agents struggle to find relevant solutions quickly.
    • Repetitive tasks: Manual triage and updates consume valuable time.

    GenAI can automate classification, suggest solutions, and even resolve incidents-but how you integrate it matters. Let’s compare two approaches.


    Architecture 1: Man-in-the-Middle (Human-in-the-Loop)

    In this approach, GenAI acts as an assistant to human agents. It analyzes tickets, suggests actions, and automates tasks but requires human approval before execution.

    Workflow Diagram:

    Use Cases:

    • High-risk scenarios (e.g., critical infrastructure changes).
    • Compliance-heavy environments (e.g., healthcare, finance).

    Implementation Steps:

    1. Set Up ServiceNow Outbound REST Integration (javascript)

    // ServiceNow Scripted REST API (Outbound)
    var request = new sn_ws.RESTMessageV2();
    request.setEndpoint('https://your-middleware.com/process-ticket');
    request.setHttpMethod('POST');
    request.setRequestBody(JSON.stringify(current));
    var response = request.execute();

    2. Build Middleware (Python/Flask Example)

    from flask import Flask, request, jsonify
    import openai

    app = Flask(__name__)
    openai.api_key = "your-api-key"

    @app.route('/process-ticket', methods=['POST'])
    def handle_ticket():
    ticket_data = request.json

    # GenAI analysis
    prompt = f"""
    Classify this ITSM ticket and suggest priority (Critical/High/Medium/Low):
    Title: {ticket_data['short_description']}
    Description: {ticket_data['description']}
    """

    response = openai.ChatCompletion.create(
    model="gpt-4",
    messages=[{"role": "user", "content": prompt}]
    )

    suggestion = response.choices[0].message['content']
    return jsonify({"suggestion": suggestion, "ticket_id": ticket_data['number']})

    3. Human Review & Action
    Agents review GenAI’s suggestions in a dashboard and approve/reject them.


    Architecture 2: GenAI Agentic Automation

    Here, GenAI agents act autonomously within guardrails. They analyze tickets, execute actions (e.g., resolving incidents, updating KBs), and only escalate exceptions to humans.

    Workflow Diagram:

    Use Cases:

    • Low-risk, repetitive tasks (e.g., password resets, FAQ responses).
    • High-volume environments needing 24/7 support.

    Implementation Steps:

    1. Autonomous Ticket Resolution with Python

    import requests
    import openai

    def resolve_ticket_automatically(ticket_id):
    # Fetch ticket from ServiceNow
    snow_url = f"https://instance.service-now.com/api/now/table/incident/{ticket_id}"
    headers = {"Accept": "application/json"}
    auth = ("admin", "password")
    response = requests.get(snow_url, headers=headers, auth=auth)
    ticket = response.json()['result']

    # GenAI analysis
    prompt = f"""
    Resolve this ticket autonomously if possible. Provide a solution and mark as closed.
    Ticket: {ticket['description']}
    """

    ai_response = openai.ChatCompletion.create(
    model="gpt-4",
    messages=[{"role": "user", "content": prompt}]
    )

    # Auto-resolve if confidence is high
    if "reset password" in ai_response.choices[0].message['content'].lower():
    update_data = {
    "state": "6", # Resolved
    "close_notes": "Automatically resolved: Password reset instructions sent."
    }
    requests.patch(snow_url, json=update_data, headers=headers, auth=auth)

    2. Guardrails for Safety

    • Limit permissions (e.g., agents can’t modify user roles).
    • Log all actions for auditing.
    • Escalate tickets containing keywords like “outage” or “data breach” to humans.

    Key Considerations

    Combined Architecture Diagram:


    Best Practices for Both Architectures

    • Data Privacy: Mask PII/PHI in tickets before sending to GenAI APIs.
    • Feedback Loops: Let agents rate AI suggestions to improve models.
    • Tooling: Use frameworks like LangChain for complex workflows.

    Conclusion

    Whether you choose man-in-the-middle or agentic automation depends on your risk tolerance and use case. Start with a hybrid approach: use autonomous agents for simple tasks (e.g., FAQs) and human-in-the-loop for critical workflows. As trust in the system grows, expand automation cautiously.

    GenAI is set to redefine ITSM, propelling organizations from automation to true intelligence. The journey is just beginning-those who embrace this shift will not only optimize IT operations but also unlock new levels of agility, resilience, and innovation. The future of ITSM is not just faster or cheaper-it’s smarter, more adaptive, and profoundly more human.

  • Infrastructure as Code (IaC) Security Best Practices

    Infrastructure as Code (IaC) Security Best Practices

    Infrastructure as Code (IaC) has revolutionized how we provision and manage infrastructure, enabling speed, repeatability, and scalability. However, as with any code, IaC introduces new security considerations. Misconfigurations, exposed secrets, and lack of visibility can lead to significant risks in production environments.

    This guide explores actionable best practices for securing your Terraform, Ansible, and other IaC pipelines-helping you build robust, compliant, and resilient infrastructure. Sample code and how-to notes included!


    1. Treat IaC Like Application Code

    Just as you would with application code, store your IaC in version control systems (e.g., Git). This enables:

    • Change tracking: Who changed what, when, and why.
    • Peer reviews: Enforce code reviews and approvals before merging.
    • Rollback: Revert to previous known-good states if issues arise.

    Tip:
    Use branch protection rules and require pull request reviews for all changes.


    2. Secrets Management

    Never hard-code secrets or sensitive data (API keys, passwords, certificates) in your IaC files. Instead:

    • Use secret management tools like HashiCorp Vault, AWS Secrets Manager, or Azure Key Vault.
    • Integrate secrets into your pipelines at runtime, not in code.
    • Leverage environment variables or encrypted files for sensitive values.

    Sample: Fetching Secrets from Vault in Terraform

    provider "vault" {
      address = "https://vault.example.com"
    }
    
    resource "vault_generic_secret" "example" {
      path = "secret/data/myapp"
    }
    
    output "db_password" {
      value = vault_generic_secret.example.data["password"]
    }

    How-to:

    • Replace https://vault.example.com with your Vault server address.
    • The vault_generic_secret resource fetches secrets dynamically.
    • Output blocks can reference secrets securely-never hardcode them!

    Sample: Encrypting Secrets in Ansible with ansible-vault

    - hosts: all
      vars_files:
        - secrets.yml
      tasks:
        - name: Use secret password
          debug:
            msg: "The password is {{ secret_password }}"

    How-to:

    • Create and encrypt the secrets file: ansible-vault create secrets.yml
    • Reference the encrypted file in your playbook under vars_files.
    • Access secrets in tasks using Jinja2 templating, e.g., {{ secret_password }}.

    3. Automated Security Scanning

    Integrate security tools into your CI/CD pipeline to catch misconfigurations and vulnerabilities early:

    Sample: Terraform Security Scanning with tfsec in GitHub Actions

    name: Terraform Security Scan
    
    on: [push]
    
    jobs:
      tfsec:
        runs-on: ubuntu-latest
        steps:
          - uses: actions/checkout@v2
          - name: Run tfsec
            uses: aquasecurity/tfsec-action@v1
            with:
              tfsec_version: 'latest'

    How-to:

    • Add this workflow to your .github/workflows directory.
    • The scan will fail the build if critical security issues are found, helping you catch problems early.

    4. Principle of Least Privilege

    Ensure that your IaC tools, pipelines, and the resources they provision follow the principle of least privilege:

    • Limit IAM permissions for automation accounts.
    • Avoid using overly broad roles or root accounts.
    • Regularly audit permissions and remove unnecessary access.

    5. Policy as Code

    Define and enforce security and compliance policies programmatically:

    • Use tools like Open Policy Agent (OPA), Sentinel (for Terraform Cloud), or Conftest.
    • Enforce rules such as “no public S3 buckets,” “encryption enabled,” or “no hardcoded credentials.”

    Example:
    OPA policies can block deployments that violate security standards before they reach production.


    6. Continuous Monitoring and Drift Detection

    Even after deployment, infrastructure can drift from the desired state:

    • Use tools like Terraform Cloud, AWS Config, or Driftctl to detect and remediate drift.
    • Set up alerts for unauthorized changes and automate remediation where possible.

    7. Regular Reviews and Updates

    IaC modules and dependencies evolve-so should your security practices:

    • Schedule regular reviews of your IaC codebase and third-party modules.
    • Update modules to patch vulnerabilities and leverage new security features.
    • Document your security practices and train your team.

    Conclusion

    Securing Infrastructure as Code is not a one-time task, but a continuous process woven into your development and deployment lifecycle. By treating IaC like application code, managing secrets securely, automating scanning, enforcing least privilege, and using policy as code, you can drastically reduce risk and build trust in your automation.

  • Multi-cloud agility with governance in ServiceNow

    I have been talking a lot lately about using ServiceNow as a tool to deliver unified end-user experience and governance for multi-cloud architectures. Most organizations today have multiple clouds public and private. This hopefully helps provide the best suitable landing zone for every workload.

    However, the mainstream approach to consuming public cloud is to give developers a credit card and say “here you go”, which is not a good governance best practice. So it doesn’t come as a surprise when an outrageous bills come at the end of the month. The other big issue with this approach is that every cloud becomes a silo. On the positive side, developers get more productive and deliver value to the business faster.

    In videos like this one you can see how it is possible to deliver a unified multi-cloud experience across multiple public and private clouds. The example uses ServiceNow but it will work for other tools like it. The principle is to offer the same type of item with comparable T-shirt sizes from a single catalog in ServiceNow. You will notice in the video how the user can see what the same VM costs on each cloud. When you pair this with chargeback, it helps developers to make the right decision as to where to run a workload. You can also throw into the mix approvals based on the characteristics of the item (ex: is the storage capacity larger than a certain amount? does the VM require too much RAM or a GPU? does the VM cost more than $100 a month?) as well as CMDB integration for resources in all clouds, etc.

    The governance benefits are enormous but developers are not equally impressed. They like to use tools like Terraform or Ansible to provision their environments at the speed of light (almost) and they will argue that going to a GUI like a ServiceNow catalog makes them slower. And of course, when developers use “Infrastructure as Code” directly on the public cloud they bypass all the governance.

    By now, probably you can guess where I am heading: is there a way of reconciling both views of the world? Ultimately the key to delivering agility via automation is having an API … and ServiceNow has a great REST API. In particular, you can order items from a service catalog using the REST API, which means that developers can order catalog items using a tool like Terraform or Ansible but still be subjected to the guardrails that the governance policies have put in place

    With this approach:

    • the organization creates a unified governance and end-user experience for all public and private cloud resources
    • developers can use Infrastructure as Code tools and processes that make them agile
    • the same REST API provides programmatic access to resources in all clouds
    • approvals and other control processes remain in place and it is easier to keep costs under control

    If you are interested in the details of how to do this, you can visit my previous post about how to create requests from a ServiceNow catalog using Ansible and Postman (what about Terraform?)

    Let’s see an example of how it works in practice. This is our infrastructure catalog. It allows the user to consume infrastructure from private and public cloud. We are going to use a STaaS (Storage-as-a-Service) as an example because the approvals are very intuitive. This catalog item allows you to provision file storage to an existing virtual machine. This item includes a capacity-based approval. The idea is that any request for more than a certain threshold is going to require an approval. You could have additional thresholds that require 2 or potentially VP approval. You can see how this constraint is going to encourage reasonable consumption by the end users. No one likes to wait for anything these days. In this demo environment the threshold is set very low, to just 50GB.

    The objective is to use code to order storage for a VM and demonstrate that:

    • if the capacity requested is lower than the threshold the request goes straight through
    • if the capacity requested is above the threshold the approval process kicks in

    We are going to use Postman to do this demonstration. You can find the Postman collection I am using in this GitHub repo. The process has essentially 2 steps: add an item to the cart and finally submit the cart. Here you can see we have sent a REST API call to add the File STaaS to the cart

    URL needs the sys_id of the catalog (get it from URL) or programmatically (with this API call). The payload needs to include quantity and all the variables required. You can find out the variables required using this API call. The status code will be 200. At this stage you can see there is 1 item in the cart

    The second step then is to submit the cart. We can do so with this REST API call. Note how it is also a POST call but it doesn’t require a Body parameter. It feels intuitive that you might have to at least specify the cart ID, but this is not necessary because a user only has one cart.

    You can see request “REQ0011028” was created. If I navigate to “Requests” for the user we can see the status of the request. The approval process is triggered because we requested 60GB which is more than the threshold. This is good because we can use Infrastructure-as-Code tools to provision infrastructure while maintaining governance.

    A key ingredient to make this both agile and useful for the business is to be wise with the thresholds. Your organization should consider what threshold provides the 80/20 or even perhaps the 90/10 rule so that the majority of provisioning activity can happen without delays.

    To finish off let’s repeat the request but this time the capacity required will be 40GB which is under the threshold.

    This time, when we go to “Requests” we can see that the request is already complete. It didn’t need an approval.

    If I log in to the Virtual Machine straight away I can see that the storage has been created, mounted and configured. As you can see I can even create a file on it.

    Conclusion

    Many organizations are implementing private clouds to that deliver a self-service experience to end-users by implementing automation and exposing it to users via an ITSM tool like ServiceNow. This architecture can be extended to consume also public cloud resources in such a way that a consistent end-user experience is delivered regardless of where the resources are created. This also brings an opportunity to break down silos and create a unified governance framework for all clouds along with integrated CMDB and incident management. This is very important especially now that cost control has become paramount. On the other hand developers demand accessing resources via API so that they can iterate faster and deliver more value to the business. In this blog post we have demonstrated how developers can leverage the ServiceNow REST API to automate the provisioning of resources in any cloud at the speed they need without jeopardizing governance.

  • Send message to Teams channel with REST API or Ansible

    There is no question Microsoft Teams is everywhere these days. Many IT teams use it to collaborate on projects or even day-to-day tasks. On the other hand engineers like to know what their automation solution is doing. Therefore, sending notifications is a very welcome addition to most automation workflows and Teams is the way to go nowadays as opposed to the venerable email. This is a skill we have used in many of our latest infrastructure automation videos in the IaC Avengers YouTube channel and a something that my customers have been wanted to learn. So here we go.

    In this article I am going to cover:

    • prepare your Teams channel to accept messages programmatically
    • use the REST API to create those messages. I will demonstrate it with Postman
    • send a message to Teams using Ansible

    Prepare a Teams channel to receive Webhooks

    The easiest to accomplish this by enabling webhooks for the channel. Webhooks allow one application to notify another of an event. As you will see in the examples later, webhooks are HTTP messages that use the POST method and include a payload that is formatted in a way that makes sense for the recipient application.

    As you can see, I have created a new channel called “Alert Testing”. We can configure webhooks for this channel by easily going into the “Connectors” option

    Once in the Connectors menu you need to find the “Incoming Webhook” option . In my menu it shows up by default at the top. If it doesn’t you can click on the “Developer Tools” category or you can type “webhook” in the search box at the top-left corner

    Now the “Incoming Webhook” configuration page pops up and the only thing we need to do is to provide a name and click “Create”. As soon as you do that it provides you with a “very long” URL as you can see at the bottom on the following screenshot. This is the URL we need to send our HTTP messages to. Now simply copy the URL and keep it somewhere handy. Finally click “Done” and we are ready.

    If you missplace the URL, don’t worry you can always go back to “Connectors” and find it in the “Configured” category.

    Send Teams messages using the REST API

    I like to use Postman when I am discovering a new REST API. It helps me track of what I am discovering and it allows me to package what I have learnt as a “collection” in a format that is easy to share. And this time is no exception. I have created a Postman collection with the 2 examples we are using in this article as well as a sample Ansible playbook. They are available at this repository in GitHub.

    What determines the format and content of the message card in Teams is the payload. You will see this in the “Body” tab. As you can see it is formatted as JSON. Cards in Teams can have a lot of features and the payload can get very complicated but as you can see the basic message only requires 2 fields.

    Don’t forget to paste the webhook URL you got from the previous step so that the message to your channel. To run it simply click “Send”. You should get a “200 OK” status code and your first message will show up in the channel straight away.

    Let’s do now a more sophisticated example. Let’s say that as part of an automation workflow we have created 2 virtual machines and we want to notify a channel in Teams and provide details of the VM’s that were just created. In the example below you can see the “title” includes the actual “id” of the provisioning job. This is something you could extract from the automation workflow and introduce it here for reference.

    In this case the payload this includes a “sections” key which we hadn’t used before. The value of this key is a list, which allows you to define multiple sections in your card. In this case we added only one section and we are populating it with a 2 column table that includes two “facts”. You can have more than 2 facts in your section or you could research how to add other elements like buttons, links …

    When we click “Send” we get our second message in the channel.

    Send Teams messages using Ansible

    Going back to the previous example you might be using Ansible to automate the creation of Virtual Machines and you want to let a team know the details of their details. As you do your provisioning tasks you can register the details of the resources you are creating and then use those to populate payload.

    In Ansible we can use the “uri” module to interact with web services. This includes REST APIs. This module allows us to specify any method we need (“POST” in this case), headers, payload etc. The following screenshot shows an Ansible playbook that creates the same card as the previous example. Notice how the payload has been converted from JSON into its YAML equivalent. You have to pay careful attention indentations and hyphens. You can download the code from the GitHub repo.

    Have fun creating your own messages!

  • ServiceNow CMDB REST API Tutorial

    In this tutorial we are going to use a practical example to show you how to use the ServiceNow REST API. I personally find ServiceNow has great online documentation but I like to see some examples to understand how other people are using it. This is the motivation for this tutorial and for the previous one on ServiceNow incidents with REST API. Let’s get to it!

    Introduction

    The CMDB (Configuration Management Database) in ServiceNow is a key component that underpins multiple services. Most organizations nowadays have a requirement to automate services delivery in order to achieve greater agility and efficiency. If we are going to implement automation in ServiceNow sooner or later we need to deal with the CMDB and the way to do this is to use the REST API.

    In this tutorial we will explore this by using a Postman collection you can find in this GitHub repo. If you need code in a specific language, Postman can help you generate code for any of the API calls in the collection. The collection also contains REST API calls to manage Incidents in ServiceNow. These calls were used in a previous tutorial called “Creating ServiceNow Incidents via REST API” which showed some examples on how to address one of the most common tasks organizations are willing to automate in ServiceNow.

    If you are reading this more than likely you know what a CMDB now, so I won’t provide much detail here. The main thing to know is that the CMDB is organized in a large hierarchy of tables. At the top of the hierarchy we have the “cmdb” table and from that a single child called “cmdb_ci”. This last table is the parent for everything else. (services, applications, servers, networks, databases …).

    All objects in this database are called “Configuration Items” or “CI” for short. You can show all the items by typing “cmdb_ci.list” in the “Navigator”. My developer instance has more than 2800 CI’s. The “class” parameter tells us what type of CI it is and as you will see it is a very important detail when dealing with the REST API.

    The CMDB is accessed in the ServiceNow interface with the “configuration” application. Once you type “configuration” in the “Navigator” you can scroll down to see everything it contains.

    The REST API

    When working with a new REST API, the first step is to learn how to authenticate. In that regard, the ServiceNow REST API is straight forward as you can use basic authentication, ie username and password.

    There are two main tools available to learn what API calls are available: the online product documentation and the REST API Explorer. In the online documentation you have to find the “REST API Reference” and then scroll down to “CMDB Instance API“. This is publicly accessible. In the following screenshot you can see it contains 7 REST API calls that allow you to do a range of CRUD operations.

    Notice how the API calls have the “classname” URL parameter. This corresponds to the “class” we mentioned earlier. Every piece of information one would expect to find (parameters, headers, status codes …) is provided in this documentation

    The second tool is the “REST API Explorer”. This a a great tool that allows you to build your API calls in a graphical manner, including the “body” payload for POST /PUT/PATCH calls. I showed how to use it in the previous tutorial “Creating ServiceNow Incidents via REST API“. However, given the sheer amount of attributes available for all classes of CI’s I am going to suggest a different way of doing this

    Learning with a practical example

    Let’s say we have an automation script that creates and configures a Linux virtual machine and as part of the same script now we want to add an entry for the virtual machine in the CMDB. The following API call is the one we need to use in order to create the CI:

    POST /now/cmdb/instance/cmdb_ci_linux_server

    This POST call requires a request “body” parameter which can have a large number of attributes as well as inbound/outbound relation information, ie how this CI is related to other CI’s. To help us configure the “body” we are going to:

    • create manually a sample resource of the same class (ie. a Linux server in this case) and configure it the way we need it. It is important to configure every attribute we want to use
    • use a GET call for that resource. The response will serve you as a very good reference for the “body” of the POST call we want to automate

    We type “configuration” and scroll down to “Servers” and click on “Linux”. Once in “Linux Servers”, click “New” to create a new Linux server. I have filled in those fields that are relevant to my use case.

    Once ready, you can click submit and the new CI will be created.

    At this point, you might want to add information on how this CI is related to other CI’s. This will be very useful for example to see what services/applications are impacted if there is an incident on this CI. In my example let’s say I want to show that this Linux server depends on a storage volume. Follow these steps:

    • Open the CI you have just created
    • Scroll down to “Related Items”
    • On the right click the “+” symbol next to “Search for CI” to open the “Relationship Editor”

    This opens the “Relationship Editor” as seen below. Now you can select the type of relationship and use the filter tool to search for the CI it depends on, ie a storage volume in our example. Then tick the CI and click the “+” symbol to add the relationship

    In my case I have also created an additional relationship with an application named “Alberto Inventory app”. For the application I chose the “Used by” relationship, meaning that the application is the one that “depends on” the Linux server. In the resulting “Relationships” table below you can see both relationships and the parent/child relationship:

    Back in Linux server record we can see at a glance the resulting relationships in the “Related Items” section. Notice how this is showing an additional relationship “Used by – Alberto Inventory Service”. I didn’t explicitly declared this relationship but I had an existing relationship between this service and the application. So in the end the service also depends on this Linux server

    Now it is time to use Postman to see what the payload looks like. Download the collection and create 2 environment variables “pwd” and “instance” as instructed in the GitHub repo. At this point you can open the “Get CMDB Linux servers” call and click “Send”. This will return a list of Linux servers. But for each of them only the “sys_id” and the “name” are displayed.

    Copy the the “sys_id” of your newly created Linux server CI and open the “GET CMDB Linux server details” call in Postman. In the URL you can the “sys_id” to the end of the URL (see highlighted in yellow) and click “Send”

    This is now showing a very good approximation of the “body” parameter we were after including attributes as well as inbound/outbound relations. Notice though, how it is nested under “result”. Notice also how the JSON payload is showing all the attributes, including attributes were not displayed in the form when we created the resource. Any attribute we didn’t specify during CI creation will be empty. At this point you can make a note of any extra attributes you want to include in your payload.

    Now in Postman let’s open the “select the “POST Create CMDB Linux server” call. This will create a second server called “alblinux02” with the same relationships as the server we created manually. Open the “Body” tab to see the JSON payload.

    The most significant change we need to make to the output of the GET call is to modify those attributes whose value was a “dictionary” with three keys (“display_value”, “link” and “value”). These kind of attributes are in the “attributes” section as well as in the “inbound and outbound relations” sections. What we need to do is to replace the whole dictionary value with just the “sys_id” which happens to be the “value” field in the GET call output

    Now we can click “Send” and the new Linux server CI will be created. You will get the status code “201 Created”. Now in the Linux servers app you should see both Linux servers.

    And if you want to see the whole stack end-to-end you can go to the “application” and click on “Show Dependency views”

    Supplementary API calls

    You might have noticed in the request “Body” of the POST call that I included several “sys_id”. While you can get “sys_id” in the ServiceNow GUI by using right-click, ultimately if you want to automate a process you will have to get that information programmatically. For that purpose the Postman collection includes three API calls to help you get “sys_id” you need:

    • CMDB relationship types
    • CMDB users
    • CMDB CI

    In the screenshot below you can see the three supplementary API calls highlighted in yellow. In the response to the “relationship types” call you would have to locate the item in the list with the “name” of the relationship you need and then extract its “sys_id”.

    The process is very similar if you need to extract the “sys_id” of a “user” or a “CI” with the other two API calls

    Tips and tricks

    It might happen that when you build the payload for a POST call, like the “Create CMDB Linux server” you might accidentally omit a mandatory attribute. You could go to the documentation to see what the mandatory attributes are, but one thing I found really useful is that the ServiceNow REST API let’s you know what you are missing in the error message. In the screenshot below I removed the “discovery_source” attribute and sent the API call. As you can see the error message let’s me know exactly what the problem is.

    One thing to bear in mind is that by default GET api calls return only 1000 records. If you are looking for a certain “CI” in order to extract its “sys_id” it might well happen that you have more than 1000 CI’s in the CMDB and the CI is not in the output. In that case you can use the “sysparm_query” parameters to narrow down the search or use the parameter “sysparm_limit” to retrieve more than 1000 records. You will notice in the Postman collection how the “Get CMDB CI” call is using “sysparm_limit” to retrieve 10000 records.

    That was a long post! Thanks for putting up with me for the last 15 mins 😉 I hope you found this tutorial useful.

  • Ansible URI Response JSON Data Parsing

    While most of the vendors and their platforms (including DellEMC) are having Ansible modules published, but there are instances where functionality you’re trying to use isn’t covered in the available module or simply modules aren’t available at all.

    In such situations you’ve no choice than using Ansible URI module. It allows you to interact with HTTP and HTTPS web services, in this particular example REST API endpoints to be precise. There are several benefits of using URI module with REST API, including but not limited to

    • Perform automation if there’s no Ansible module available
    • Use functionality that hasn’t been implemented in Ansible modules
    • Easier to redeploy your workflow to another automation tool

    While I was using the URI module I came across issue of data parsing for REST API response payload. In case of Dell EMC platforms response payload is in JSON and based on the API endpoint response can be 1000s of lines. It’s very difficult to make sense of this data and also process the same in ansible to extract required information. In this blog post I am trying to list down the process I’ve followed to parse the JSON data and extract the required information.

    Below is the sample playbook having uri module. In this example we’re talking about GET call for sample URI endpoint – which is getting device details of the existing server (BMaaS use case).

      tasks:
      - name: listdevices
        uri:
          url: https://api.sample.com/base/version/endpoint
          method: GET
          validate_certs: no
          headers:
            X-Auth-Token: "{{ api_key }}"
          status_code: 200
        register: output
        
      - name: printoutput
        ansible.builtin.debug: 
          var: output

    In this playbook there are multiple parameters used under uri task. More on using uri module with REST API coming in another blog post.

    In above example you can see that we’ve registering the output and then printing the same. Problem with this is there could be 100s of lines which probably doesn’t make sense. So for parsing this data we will need

    Below is the sample of the GET call JSON response.

    [
        {
            "id": "2b12858454174f03aece5a71bb382318",
            "name": "Drive_0_0_11",
            "extra_details": {
                "firmware_version": "GPJ99E5Q",
                "drive_type": "NVMe_SSD",
                "encryption_status": "Supported_Locked_Cluster_PIN",
                "fips_status": "FIPS_Compliance_Level_1",
                "size": 3840755982336
            }
        },
        {
            "id": "2dd2c43f2582415585a9ce0bbb961a4f",
            "name": "Drive_0_0_0",
            "extra_details": {
                "firmware_version": "GPJ99E5Q",
                "drive_type": "NVMe_SSD",
                "encryption_status": "Supported_Locked_Cluster_PIN",
                "fips_status": "FIPS_Compliance_Level_1",
                "size": 3840755982336
            }
        },
        {
            "id": "325e5abc34ed4be398715285cf2e2826",
            "name": "Drive_0_0_8",
            "extra_details": {
                "firmware_version": "GPJ99E5Q",
                "drive_type": "NVMe_SSD",
                "encryption_status": "Supported_Locked_Cluster_PIN",
                "fips_status": "FIPS_Compliance_None",
                "size": 3840755982336
            }
        },
        {
            "id": "3c9449f55ade4c04a801e804f3872eff",
            "name": "Drive_0_0_5",
            "extra_details": {
                "firmware_version": "GPJ99E5Q",
                "drive_type": "NVMe_SSD",
                "encryption_status": "Supported_Locked_Cluster_PIN",
                "fips_status": "FIPS_Compliance_None",
                "size": 3840755982336
            }
        },
        {
            "id": "426d706ef7d443a887a450e6ac4abed5",
            "name": "Drive_0_0_23",
            "extra_details": {
                "firmware_version": "3.0.45.6",
                "drive_type": "NVMe_NVRAM",
                "encryption_status": "Supported_Locked_Cluster_PIN",
                "fips_status": "FIPS_Compliance_None",
                "size": 8484552704
            }
        },
        {
            "id": "42f2145cc5ef4a5f86ec1dfe8bdc5ca3",
            "name": "Drive_0_0_24",
            "extra_details": {
                "firmware_version": "3.0.45.6",
                "drive_type": "NVMe_NVRAM",
                "encryption_status": "Supported_Locked_Cluster_PIN",
                "fips_status": "FIPS_Compliance_None",
                "size": 8484552704
            }
        },
        {
            "id": "4ed0b8b74eff4113ad85ded6f342ab34",
            "name": "Drive_0_0_6",
            "extra_details": {
                "firmware_version": "GPJ99E5Q",
                "drive_type": "NVMe_SSD",
                "encryption_status": "Supported_Locked_Cluster_PIN",
                "fips_status": "FIPS_Compliance_None",
                "size": 3840755982336
            }
        },
        {
            "id": "5bca4db416c342ebab6d3b795c604963",
            "name": "Drive_0_0_2",
            "extra_details": {
                "firmware_version": "GPJ99E5Q",
                "drive_type": "NVMe_SSD",
                "encryption_status": "Supported_Locked_Cluster_PIN",
                "fips_status": "FIPS_Compliance_None",
                "size": 3840755982336
            }
        },
        {
            "id": "6eb66e909f4b414193922e4de63cfa9f",
            "name": "Drive_0_0_1",
            "extra_details": {
                "firmware_version": "GPJ99E5Q",
                "drive_type": "NVMe_SSD",
                "encryption_status": "Supported_Locked_Cluster_PIN",
                "fips_status": "FIPS_Compliance_None",
                "size": 3840755982336
            }
        },
        {
            "id": "b413b5e98e6245b58134c0d5a8d001e1",
            "name": "Drive_0_0_7",
            "extra_details": {
                "firmware_version": "GPJ99E5Q",
                "drive_type": "NVMe_SSD",
                "encryption_status": "Supported_Locked_Cluster_PIN",
                "fips_status": "FIPS_Compliance_None",
                "size": 3840755982336
            }
        },
        {
            "id": "bae7ed28120e43a8b322b8d8b2fedc0d",
            "name": "Drive_0_0_10",
            "extra_details": {
                "firmware_version": "GPJ99E5Q",
                "drive_type": "NVMe_SSD",
                "encryption_status": "Supported_Locked_Cluster_PIN",
                "fips_status": "FIPS_Compliance_None",
                "size": 3840755982336
            }
        },
        {
            "id": "bea9d084e49248359e3191d8f648a37c",
            "name": "Drive_0_0_3",
            "extra_details": {
                "firmware_version": "GPJ99E5Q",
                "drive_type": "NVMe_SSD",
                "encryption_status": "Supported_Locked_Cluster_PIN",
                "fips_status": "FIPS_Compliance_None",
                "size": 3840755982336
            }
        },
        {
            "id": "f3af5ea2e84d4181a9068c6e85c4b750",
            "name": "Drive_0_0_4",
            "extra_details": {
                "firmware_version": "GPJ99E5Q",
                "drive_type": "NVMe_SSD",
                "encryption_status": "Supported_Locked_Cluster_PIN",
                "fips_status": "FIPS_Compliance_None",
                "size": 3840755982336
            }
        },
        {
            "id": "fca0678677cf48f5a51c28ea1e47b514",
            "name": "Drive_0_0_9",
            "extra_details": {
                "firmware_version": "GPJ99E5Q",
                "drive_type": "NVMe_SSD",
                "encryption_status": "Supported_Locked_Cluster_PIN",
                "fips_status": "FIPS_Compliance_None",
                "size": 3840755982336
            }
        }
    ]

    In above JSON example if I have to extract only name and id from the JSON, then we will need to parse the data in playbook as a separate task. Sample task is as mentioned below.

      - name: devicenames
        set_fact: 
          devicenames: "{{ devices | json_query(jmesquery) }}"
        vars:
          jmesquery: '*.devices[*].[name, id]'

    So, overall the playbook will look like below

    ---
    - hosts: localhost
      gather_facts: no
    
      tasks:
      - name: getdevices
        uri:
          url: https://<target_api_server>/v1/definition/endpoint
          method: GET
          #body_format: json
          validate_certs: no
          headers:
            X-Auth-Token: "{{ api_key }}"
          #body:
          #- [ name, your_username ]
          #- [ password, your_password ]
          #- [ enter, Sign in ]
          status_code: 200
        register: devices
        
      #- name: save the json as variable
      #  set_fact: 
      #    jsondata: "{{ devices.stdout | from_json }}"
      
      - name: devicenames
        set_fact: 
          devicenames: "{{ devices | json_query(jmesquery) }}"
        vars:
          jmesquery: '*.devices[*].[hostname, id]'
          
      - name: print devicenames
        debug:
          msg: "{{ item }}"
        with_items:
        - "{{ devicenames }}"

    In this example I’ve printed the captured device value. But in real life scenario it can be captured as a variable and use as input for subsequent tasks.

  • Dell EMC VxRAIL – Using REST API

    Dell EMC VxRAIL – Using REST API

    There are many use cases where VxRAIL manager, VMware vCenter Console, or vSuite will not be enough for your goals in mind. So, for monitoring and management of your VxRAIL cluster, you can utilize the VxRAIL REST API for achieving your end goal in mind.

    There are multiple ways to get your hands around the VxRAIL REST API

    1. VxRAIL REST API Cookbook – PDF Guide
    2. VxRAIL SwaggerUI

    VxRAIL Swagger UI is always (default) runs on the VxRAIL cluster and can be accessed using a browser. Link for accessing the VxRAIL Swagger UI is – https://<VxRAIL_Manager_IP>/rest/vxm/api-doc.html

    VxRAIL – Swagger UI

    From the Swagger UI (top right – Select a definition drop-down) you can select the categories of API calls. By default, Swagger UI opens into the Day 1 Bring Up Configuration.

    Additionally VxRAIL Swagger UI allows you to play with the APIs on the same page. For this you’ll need to Authorize the page using VxRAIL manager credentials. This is to make sure that user is restricted to the right level of authorization based on their user type.

    For executing / trying the APIs on the VxRAIL cluster you can simply choose the definition from the drop-down. In this case I’ve selected Cluster definition.

    VxRAIL – Select Definition

    If you expand the selected API it will show you multiple sections (Cluster Information in this example)

    VxRAIL – Cluster Information
    • Parameters – Some APIs needs parameters as input for the successful exectution. If applicable they will be listed here
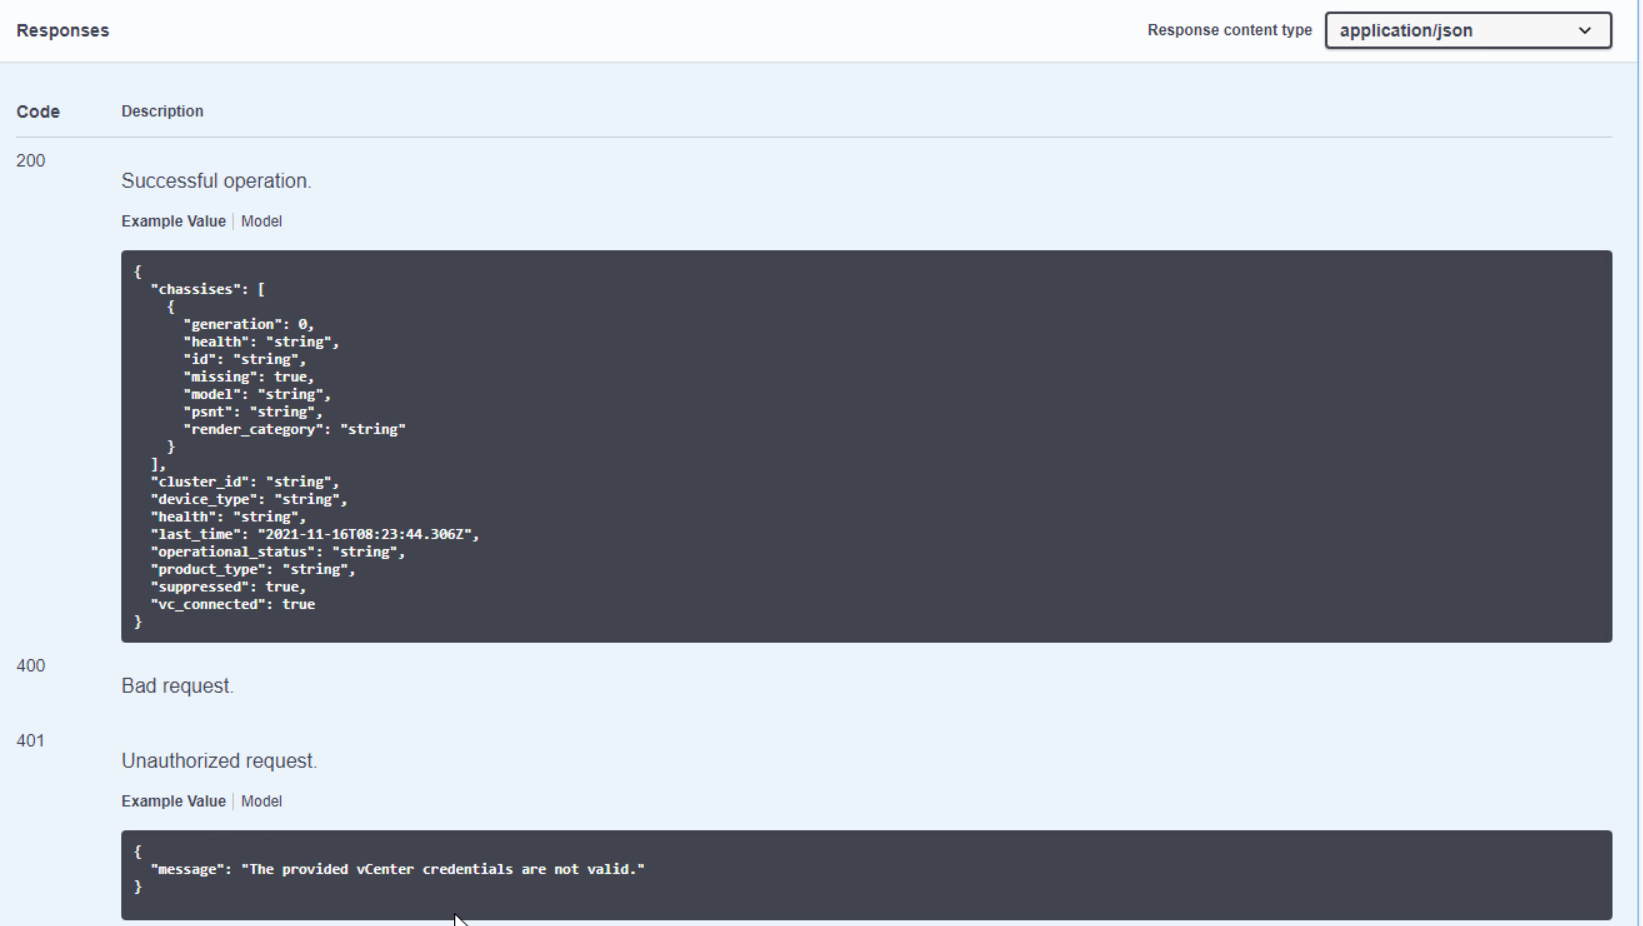
    • Responses – This section shows you the possible response codes for selected API with example output snippet.

    When you click on the Try it out button page gets into the run-mode. Once you enter required parameters (not required in this example) you can click on Execute. At this point request will be sent to VxRAIL manage and response (body and headers) will be shown on the same screen.

    Way Forward

    I hope this gave you the high level overview of VxRAIL APIs and how to access them. Though Swagger has built-in option to try the APIs, but that is the just a API explorer tool. Additionally you can also use the REST clients – like Postman – to interact with the API. Eventually you’ll integrate these APIs with your automation tools – those can be VMware vRA, Ansible, Terraform, or it can be your own developed tool. Technically speaking you can use any tool as far as it has option to interact with REST API.

    More on this coming in next blog posts 🙂

  • Creating ServiceNow Incidents via REST API

    Creating ServiceNow Incidents via REST API

    In this article we will explore how to create incidents in ServiceNow using the REST API. This article was a stepping stone for this video that shows how to integrate ServiceNow, Microsoft Teams and alerts from infrastructure. You might also be interested in the second post in this series: ServiceNow CMDB REST API tutorial

    The very first thing to do when working with a REST API is to get your hands on the reference guide and hopefully the getting started guide if there is one. The first thing to look for is how to authenticate with the API and whether there are any requirements for special headers or things like that. Afterwards things tend to flow faster and easier. Fortunately, ServiceNow supports basic authentication so there is no learning curve there, although it does support more secure authentication through OAuth if you need it

    In terms of documentation the online help is great. Here you can get an overview of the API. And this is the starting point for the online REST API reference. There are many branches or child API’s hanging of this root. In the screenshot below you can see how, for every call, the online help shows the URL (default or for a specific version) and parameters (path, query and request body). Further down it shows headers for the request and the response and even two coding examples for curl and python … as complete as it gets

    But the tool you will learn to love very quickly is the “REST API Explorer”. Please note that this is a tool that you can only access from within your instance. Once you log in go to “System Web Services” and then locate “REST API Explorer” as shown here

    You will then end up with a menu like this. Notice how you can select the specific child API in the top-left corner and the version of your environment.

    ServiceNow stores all data in tables. This is also true for Incidents which unsurprisingly are stored in the “incident” table. To manipulate tables we need to use the Table API. Different HTTP methods will enable us to do the various CRUD operations. For example if we want to create an incident we will have to use the POST method. Notice in the previous image how I have selected the “Table API” and within that API the “Create a record (POST)” call. Then on the right I have selected the “incident” table.

    When you scroll down you can see a dialog that allows you to build the request body for the incident creation. With the drop-down menu you can select from all the available fields. As you select new fields and assign values, the REST API Explorer builds the body for you in the text box immediately below. At the very bottom you can generate code in multiple languages

    We have grouped the API calls we are using in this article into a Postman collection. You can download the collection from the following the following GitHub repo :

    https://github.com/cermegno/postman-servicenow

    The collection uses 2 variables that you must add to an environment. If you are new to Postman environments check out this older article:

    • {{pwd}}. This is the password for the “admin” user of your ServiceNow instance. If you need to use a different user, you can change it in the collection settings
    • {{instance}}. This is your ServiceNow instance name, i.e. excluding the “.service-now.com” suffix. If you don’t have one or you cannot test this with your production instance, you can open your very own developer instance with ServiceNow

    The collection provides 4 calls and a saved example for each call:

    • Get details for all incidents. This will produce a 98 line JSON structure for each incident
    • Get details for a single incident. This requires you to pass the “sys_id” of the incident as part of the URL as shown below. You can get the “sys_id” for a specific incident from the body of the response during the creation (POST) operation
    • Create incident (POST). The JSON Body parameter can take “a lot” of fields but you can start small. For example the following Body produces the incident below:
    • Modify incident (PUT). This will allow you to make changes to incidents. In particular you can use it to resolve/close incidents by setting the state to “7” as shown in the screenshot below. This call also requires you to pass the “sys_id” of the incident you are modifying as part of the URL

    In this article we have used the REST API to interact with ServiceNow because this is the way I will do it in the upcoming video demo. But depending on what you are trying to do you might want to use Ansible. In that case you can use the official Ansible modules provided by ServiceNow themselves. The collection is available in Ansible Galaxy and provides just two modules designed to interact with ServiceNow tables. Follow the instructions in the Ansible Galaxy page to install the dependencies including the “pysnow” Python library

    As a next step you can visit the second post in this series: ServiceNow CMDB REST API tutorial

    We hope you find this article helpful. Let us know your thoughts in the comment section.

  • REST API and DellEMC Storage Part 3 – Unity

    REST API and DellEMC Storage Part 3 – Unity

    This blog post is 3rd part of REST API with DellEMC Storage blog series.

    • In the first part of this blog series, we discussed what is REST API and different usage options
    • Second part was about managing DellEMC PowerMax storage arrays using REST API

    In this post, we will discuss how you can use manage DellEMC Unity storage using REST API. We will be using the Postman tool during the entire blog series. So let’s get started with automating the DellEMC Unity storage system.

    The DellEMC Unity REST API Background

    DellEMC Unity is of the most user-friendly storage systems. The most common management tools for Unity systems are

    • Unisphere UI (Embedded) – An HTML5 graphical user interface used to manage Dell EMC Unity systems
    • Unisphere Command Line Interface (UEMCLI) – UEMCLI allows a user to perform tasks on the storage system by typing commands instead of using the graphical user interface

    The Dell EMC Unity includes complete REST API support, providing a developer-friendly way to manage Dell EMC Unity systems and automate various tasks.

    Dell EMC Unity’s REST API fully supports all the management tasks that a user can perform in the Unisphere GUI. Dell EMC Unity’s REST API response formats all communication in JSON notation. Users can send REST API requests using their favorite REST API tools to manage Dell EMC Unity systems in their environment. This provides flexibility in management and opens possibilities for more complex operations.

    DellEMC Unity Management Options

    Assessing DellEMC Unity’s REST API

    Once a Unity system is up and running, users can navigate to the following web addresses to get access to the REST API documentation:

    REST API Programmer’s Guide – https://{{unisphere_management_address}}/apidocs/programmers-guide/index.html

    REST API Reference Guide https://{{unisphere_management_address}}/apidocs/index.html

    DellEMC Unity’s REST API is available via Unisphere running on the array via the following Base URL.

    https://{{unisphere_management_address}}/api

    • {{unisphere_management_address}} – Replace with IP Unisphere IP address or hostname

    Supported DellEMC Unity REST API Operations

    DellEMC Unity’s REST API supports the following types of REST calls.

    • GET – Get information on objects. For example – Get Unity storage system’s details
    • POST – Create an Object. For example – Create new LUN/s
    • PUT – Making changes to an objects. For example – Change size of the existing LUN
    • DELETE – Remove an object. For example – Delete existing LUN/s

    Usually the REST client (like Postman) can be used to help figure out what REST calls you want to run.

    Building your REST API calls

    Now let’s get started with creating REST API calls. In this example we will create sample REST API call to list all the available storage pools.

    Before we get started make sure you’ve Postman installed and Unisphere is reachable.

    • Open Postman and click on New. Under new drop-down, select Request
    DellEMC Unity REST API – Postman tool GUI – 1
    • In New Request pop-up enter Request nameDescription (optional) and Name of the Collection. Then click on Save.
    DellEMC Unity REST API – Postman tool GUI – 2
    • Click on the request type drop-down and select GET.
      • Please note that we are selecting GET because is this example we are creating sample REST API call to list all the available storage pools.
      • This option will be different based on type of REST API operation
    DellEMC Unity REST API – Postman tool GUI – 3
    • Enter below Request URL
      • 1.1.1.1 – Replace with Unisphere IP address/hostname

    https://1.1.1.1/api/types/pool/instances

    DellEMC Unity REST API – Postman tool GUI – 4
    • Click on the Authorization. Enter Unisphere Username and Password.
    DellEMC Unity REST API – Postman tool GUI – 5
    • Note that Unity REST API GET request needs below 3 headers. Click on Headers and enter below header details as shown in the screenshot. Then click Send
      • Accept – application/json
      • Content-type – application/json
      • X-EMC-REST-CLIENT – true
    DellEMC Unity REST API – Postman tool GUI – 5
    • In the Postman Response section you’ll see REST API response. In this case you’ll see list of all the storage pools in Unity array.
    DellEMC Unity REST API – Postman tool GUI – 6

    Additionally please note that POST/PUT/DELETE requests need one additional Header – EMC-CSRF-TOKEN. This token is generated using GET request.

    So, let’s create one POST request for creating new LUN.

    • Follow above-listed GET request steps. Click on Headers under GET Response. Copy the EMC-CSRF-TOKEN from the Headers
    DellEMC Unity REST API – Postman tool GUI – 7
    • Now click on New and Under new drop-down, select Request (screenshot in GET request steps)
    • In New Request pop-up enter Request nameDescription (optional) and Name of the Collection. Then click on Save. (screenshot in GET request steps)
    • Click on the request type drop-down and select POST.
      • Please note that we are selecting POST because is this second example we are creating REST API call to create new LUN.
    • Click on the Authorization. Enter Unisphere Username and Password.
    • Under Params enter below details.
      • Name – Name of the LUN
      • Pool – Storage Pool in which LUN will be created
      • Size – LUN size
    DellEMC Unity REST API – Postman tool GUI – 7
    • Click on Headers and enter below header details as shown in the screenshot. Then click Send
      • Accept – application/json
      • Content-type – application/json
      • X-EMC-REST-CLIENT – true
      • EMC-CSRF-TOKEN – Copied from GET response
    DellEMC Unity REST API – Postman tool GUI – 8

    Dell EMC and REST API – Way Forward

    I hope this clarifies many basics for getting started with REST API and DellEMC Unity storage. You might also have understood that creating creating valid URLs is very important aspect of using REST API. Having this in mind we have created ready Postman collection for DellEMC Unity storage. Here’s the GitHub link to the repository. Feel free to download and share.

    Below are the additional resources available for taking REST API usage to next level.

    I hope this post will get you started with your Dell EMC Unity automation journey.